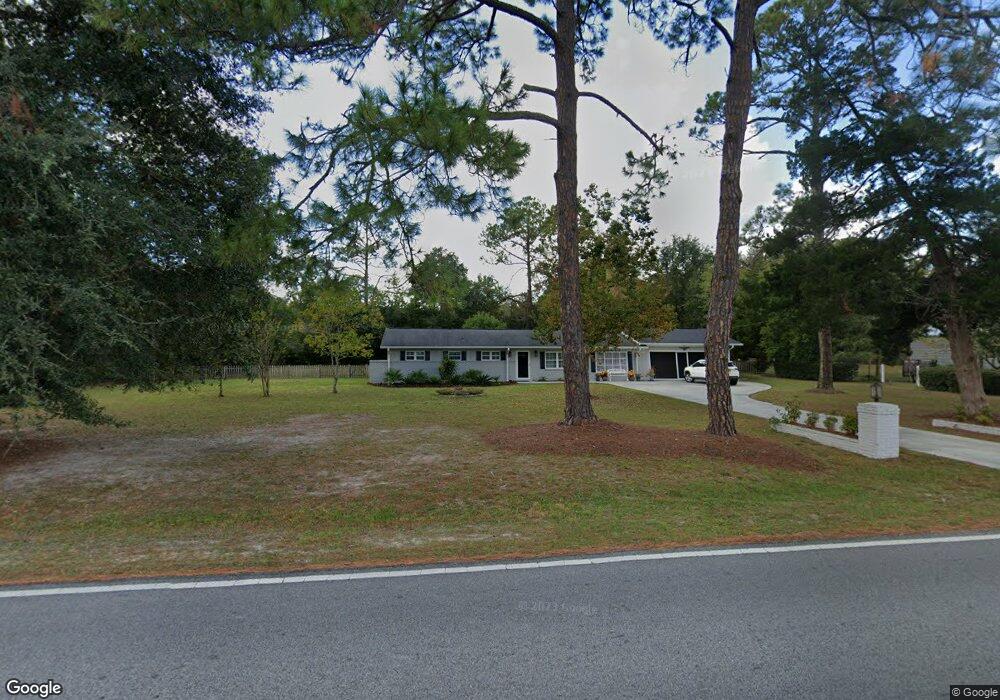
835 Tomberlin Rd Waycross, GA 31503
Estimated Value: $217,012 - $285,000
3
Beds
3
Baths
1,570
Sq Ft
$161/Sq Ft
Est. Value
About This Home
This home is located at 835 Tomberlin Rd, Waycross, GA 31503 and is currently estimated at $253,503, approximately $161 per square foot. 835 Tomberlin Rd is a home located in Ware County with nearby schools including Williams Heights Elementary School, Waycross Middle School, and Ware County High School.
Ownership History
Date
Name
Owned For
Owner Type
Purchase Details
Closed on
Nov 4, 2020
Sold by
Craven Robert M
Bought by
Womick William Glenn and Womick Alice R
Current Estimated Value
Home Financials for this Owner
Home Financials are based on the most recent Mortgage that was taken out on this home.
Original Mortgage
$132,000
Outstanding Balance
$116,783
Interest Rate
2.8%
Mortgage Type
New Conventional
Estimated Equity
$136,720
Purchase Details
Closed on
Sep 27, 2019
Sold by
Farmers Leasing Llc
Bought by
Craven Robert M
Home Financials for this Owner
Home Financials are based on the most recent Mortgage that was taken out on this home.
Original Mortgage
$10,000,000
Interest Rate
3.5%
Mortgage Type
Commercial
Purchase Details
Closed on
Sep 26, 2018
Sold by
Farmer Dennis James
Bought by
Farmers Leasing Llc
Purchase Details
Closed on
Apr 22, 2015
Sold by
Farmer I John
Bought by
Farmer Dennis James
Create a Home Valuation Report for This Property
The Home Valuation Report is an in-depth analysis detailing your home's value as well as a comparison with similar homes in the area
Home Values in the Area
Average Home Value in this Area
Purchase History
| Date | Buyer | Sale Price | Title Company |
|---|---|---|---|
| Womick William Glenn | $165,000 | -- | |
| Craven Robert M | $50,000 | -- | |
| Farmers Leasing Llc | -- | -- | |
| Farmer Dennis James | -- | -- |
Source: Public Records
Mortgage History
| Date | Status | Borrower | Loan Amount |
|---|---|---|---|
| Open | Womick William Glenn | $132,000 | |
| Previous Owner | Craven Robert M | $10,000,000 |
Source: Public Records
Tax History Compared to Growth
Tax History
| Year | Tax Paid | Tax Assessment Tax Assessment Total Assessment is a certain percentage of the fair market value that is determined by local assessors to be the total taxable value of land and additions on the property. | Land | Improvement |
|---|---|---|---|---|
| 2024 | $877 | $77,303 | $9,300 | $68,003 |
| 2023 | $894 | $58,788 | $8,000 | $50,788 |
| 2022 | $983 | $58,788 | $8,000 | $50,788 |
| 2021 | $1,018 | $50,541 | $8,000 | $42,541 |
| 2020 | $1,153 | $36,373 | $8,000 | $28,373 |
| 2019 | $969 | $29,971 | $8,000 | $21,971 |
| 2018 | $882 | $29,020 | $8,000 | $21,020 |
| 2017 | $881 | $29,020 | $8,000 | $21,020 |
| 2016 | $881 | $29,020 | $8,000 | $21,020 |
| 2015 | $889 | $29,020 | $8,000 | $21,020 |
| 2014 | -- | $29,020 | $8,000 | $21,020 |
| 2013 | -- | $29,020 | $8,000 | $21,020 |
Source: Public Records
Map
Nearby Homes
- 3070 Central Ave
- 867 Kentland Dr
- 763 Kentland Dr
- 2775 Seminole Trail
- 3153 Southwood Dr
- 1132 Hilltop Rd
- 723 St Bernard Trail
- 1049 Riverdale Dr
- 955 Lynn Dr
- 3817 Central Ave
- 914 Barkley St
- 4155 Pinecrest Rd
- 291 Sawdust Trail
- 0 Brunswick Hwy Unit 1648370
- 606 Stonewall Jackson Place
- 630 Saddle Cir
- 664 Saddle Cir
- 1312 Atlantic Ave
- 1072 Lawhorne Dr
- 627 Saddle Cir
- 795 Tomberlin Rd
- 3166 Central Ave
- 830 Williams Ln
- 3220 Central Ave
- 3112 Central Ave
- 3187 Wood Duck Dr
- 3165 Wood Duck Dr
- 3141 Wood Duck Dr
- 833 Williams Ln
- 3140 Bethany Ln
- 3115 Wood Duck Dr
- 3248 Sherry Ln
- 3279 Sherry Ln
- 745 Tomberlin Rd
- 3164 Wood Duck Dr
- 750 Tomberlin Rd
- 3069 Wood Duck Dr
- 922 Wood Valley Rd
- 3140 Wood Duck Dr
- 3280 Sherry Ln