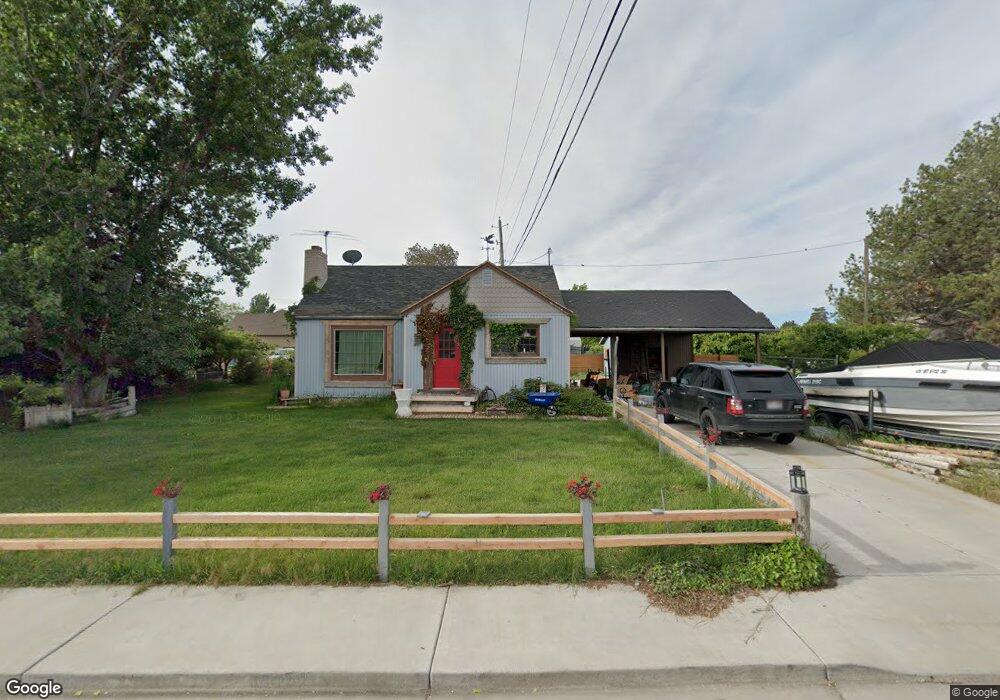
835 W 100 S Orem, UT 84058
Orem Park NeighborhoodEstimated Value: $371,000 - $378,000
2
Beds
1
Bath
847
Sq Ft
$441/Sq Ft
Est. Value
About This Home
This home is located at 835 W 100 S, Orem, UT 84058 and is currently estimated at $373,771, approximately $441 per square foot. 835 W 100 S is a home located in Utah County with nearby schools including Orem Elementary School, Orem Junior High School, and Mountain View High School.
Ownership History
Date
Name
Owned For
Owner Type
Purchase Details
Closed on
Jul 9, 2003
Sold by
Hoefnagels Mary Louise
Bought by
Hoefnagels Mary Louise and Hoefnagels Paul J M
Current Estimated Value
Purchase Details
Closed on
Sep 18, 2002
Sold by
Hoefnagels Mary Louise
Bought by
Hoefnagels Paul J M and Hoefnagels Mary Louise
Purchase Details
Closed on
May 8, 2002
Sold by
Smith Arthur Flint
Bought by
Hoefnagels Mary Louise
Purchase Details
Closed on
Oct 7, 1998
Sold by
Hunter Travis J and Hunter Malissa
Bought by
Smith Arthur Flint
Home Financials for this Owner
Home Financials are based on the most recent Mortgage that was taken out on this home.
Original Mortgage
$97,650
Interest Rate
6.79%
Purchase Details
Closed on
Oct 11, 1996
Sold by
Hunter Kristine L
Bought by
Hunter Travis J and Hunter Malissa
Home Financials for this Owner
Home Financials are based on the most recent Mortgage that was taken out on this home.
Original Mortgage
$82,000
Interest Rate
8.37%
Create a Home Valuation Report for This Property
The Home Valuation Report is an in-depth analysis detailing your home's value as well as a comparison with similar homes in the area
Home Values in the Area
Average Home Value in this Area
Purchase History
| Date | Buyer | Sale Price | Title Company |
|---|---|---|---|
| Hoefnagels Mary Louise | -- | First American Title Co | |
| Hoefnagels Mary Louise | -- | First American Title Co | |
| Hoefnagels Paul J M | -- | First American Title Co | |
| Hoefnagels Mary Louise | -- | First American Title Co | |
| Smith Arthur Flint | -- | -- | |
| Hunter Travis J | -- | -- |
Source: Public Records
Mortgage History
| Date | Status | Borrower | Loan Amount |
|---|---|---|---|
| Previous Owner | Smith Arthur Flint | $97,650 | |
| Previous Owner | Hunter Travis J | $82,000 |
Source: Public Records
Tax History
| Year | Tax Paid | Tax Assessment Tax Assessment Total Assessment is a certain percentage of the fair market value that is determined by local assessors to be the total taxable value of land and additions on the property. | Land | Improvement |
|---|---|---|---|---|
| 2025 | $1,317 | $176,275 | -- | -- |
| 2024 | $1,317 | $160,985 | $0 | $0 |
| 2023 | $1,203 | $158,125 | $0 | $0 |
| 2022 | $1,356 | $172,645 | $0 | $0 |
| 2021 | $1,257 | $242,500 | $174,400 | $68,100 |
| 2020 | $1,088 | $206,300 | $139,500 | $66,800 |
| 2019 | $992 | $195,500 | $128,700 | $66,800 |
| 2018 | $897 | $169,000 | $110,900 | $58,100 |
| 2017 | $824 | $83,105 | $0 | $0 |
| 2016 | $792 | $73,700 | $0 | $0 |
| 2015 | $838 | $73,700 | $0 | $0 |
| 2014 | $823 | $72,105 | $0 | $0 |
Source: Public Records
Map
Nearby Homes
- 896 W 30 S
- 237 S Ridgeview Dr
- 45 N 970 W
- 935 W 360 S
- 155 S 1200 W Unit 69
- 155 S 1200 W Unit 6
- 155 S 1200 W Unit 97
- 565 W 40 N
- 508 W 40 N
- 506 S 800 West St Unit 13
- 520 S 800 W Unit 14
- 216 S 400 W
- 350 S 1200 W Unit 2
- 570 S 800 West St Unit 15
- 162 N 450 W Unit 2
- 1225 W 160 N
- 62 N 380 W
- 222 N 1200 W Unit 144
- 222 N 1200 W Unit 53
- 222 N 1200 W Unit 84
Your Personal Tour Guide
Ask me questions while you tour the home.