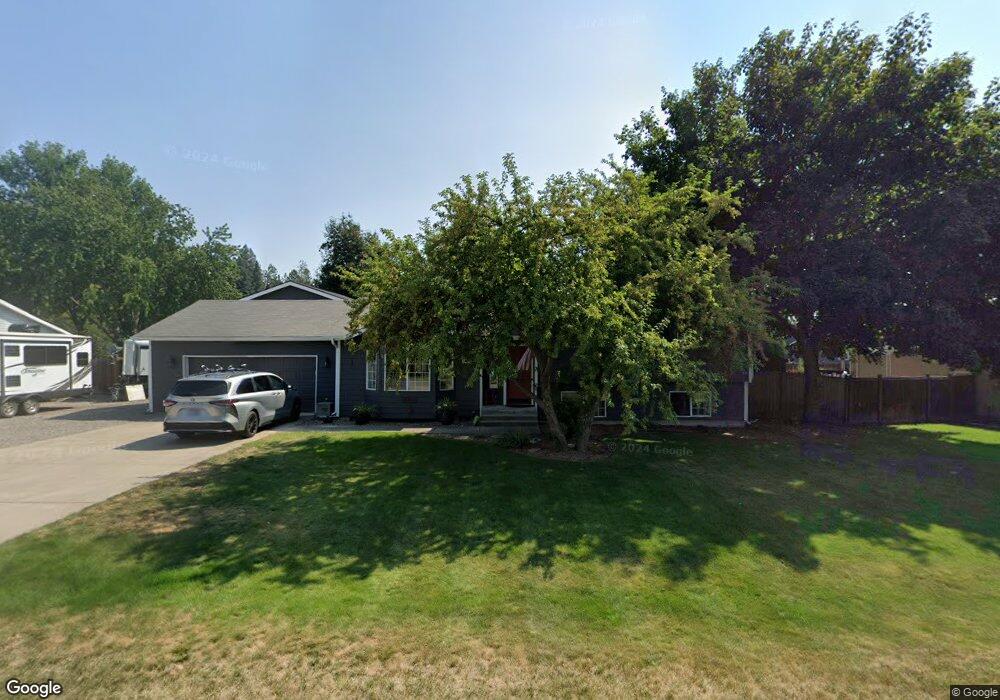
8350 N Summerfield Loop Hayden, ID 83835
Estimated Value: $550,000 - $565,000
4
Beds
3
Baths
1,957
Sq Ft
$284/Sq Ft
Est. Value
About This Home
This home is located at 8350 N Summerfield Loop, Hayden, ID 83835 and is currently estimated at $556,550, approximately $284 per square foot. 8350 N Summerfield Loop is a home located in Kootenai County with nearby schools including Dalton Elementary School, Canfield Middle School, and Coeur d'Alene High School.
Ownership History
Date
Name
Owned For
Owner Type
Purchase Details
Closed on
Mar 26, 2024
Sold by
Spoor Shannon and Graham Davin
Bought by
Davin And Shannon Graham Living Trust and Graham
Current Estimated Value
Purchase Details
Closed on
Feb 15, 2018
Sold by
Richards Jeffrey W
Bought by
Spoor Shannon and Graham Davin
Home Financials for this Owner
Home Financials are based on the most recent Mortgage that was taken out on this home.
Original Mortgage
$235,000
Interest Rate
4.15%
Mortgage Type
New Conventional
Purchase Details
Closed on
Feb 20, 2009
Sold by
Richards Jeffrey W and Spoor Shannon
Bought by
Richards Jeffrey W and Spoor Shannon
Home Financials for this Owner
Home Financials are based on the most recent Mortgage that was taken out on this home.
Original Mortgage
$225,885
Interest Rate
4.91%
Mortgage Type
FHA
Create a Home Valuation Report for This Property
The Home Valuation Report is an in-depth analysis detailing your home's value as well as a comparison with similar homes in the area
Home Values in the Area
Average Home Value in this Area
Purchase History
| Date | Buyer | Sale Price | Title Company |
|---|---|---|---|
| Davin And Shannon Graham Living Trust | -- | None Listed On Document | |
| Spoor Shannon | -- | Alliance Title | |
| Richards Jeffrey W | -- | -- |
Source: Public Records
Mortgage History
| Date | Status | Borrower | Loan Amount |
|---|---|---|---|
| Previous Owner | Spoor Shannon | $235,000 | |
| Previous Owner | Richards Jeffrey W | $225,885 |
Source: Public Records
Tax History
| Year | Tax Paid | Tax Assessment Tax Assessment Total Assessment is a certain percentage of the fair market value that is determined by local assessors to be the total taxable value of land and additions on the property. | Land | Improvement |
|---|---|---|---|---|
| 2025 | $1,765 | $534,476 | $190,000 | $344,476 |
| 2024 | $1,750 | $538,689 | $190,000 | $348,689 |
| 2023 | $1,750 | $521,688 | $195,000 | $326,688 |
| 2022 | $1,928 | $562,856 | $225,000 | $337,856 |
| 2021 | $1,525 | $334,995 | $135,000 | $199,995 |
| 2020 | $1,592 | $293,643 | $126,000 | $167,643 |
| 2019 | $1,398 | $255,040 | $105,000 | $150,040 |
| 2018 | $1,316 | $229,650 | $96,000 | $133,650 |
| 2017 | $1,686 | $210,440 | $79,860 | $130,580 |
| 2016 | $1,643 | $196,570 | $72,600 | $123,970 |
| 2015 | $2,156 | $192,140 | $66,000 | $126,140 |
| 2013 | $1,006 | $158,420 | $46,000 | $112,420 |
Source: Public Records
Map
Nearby Homes
- 8776 N Wayne Dr
- 8205 N Ridgewood Dr Unit 3
- 7959 N Valley St
- 536 E Cloverleaf Dr
- 798 E Loch Maree Dr
- 858 E Maple Place
- 8459 N Sunny Ln Unit 153
- 8509 N Sunny Ln
- 8901 N Starr Loop
- 8570 N Hayden Pines Way
- 9140 N Starr Loop
- 9156 N Starr Loop
- 9157 Piper
- 660 E Ripatti Way
- 1268 E Woodstone Ct
- 9262 N Secretariat Ln
- 126 E Willow Tree Ln
- 7535 N Mount Carrol St
- 693 Monashee Ct
- 8429 N Snowflake Ln
- 8320 N Summerfield Loop
- NNA N Summerfield Loop
- 0 N Summerfield Loop
- 8376 N Summerfield Loop
- 8295 N Patriot Ct
- 8295 N Patriot Ct
- 8381 N Maple St
- 8283 N Patriot Ct
- 8331 N Summerfield Loop
- 8298 N Patriot Ct
- 0 Flatwood Loop Lt 10 Bk 1
- 8396 N Summerfield Loop
- 8400 N Maple St
- 8399 N Maple St
- 8282 N Parkside Ct
- 8342 N Atwood Dr
- 8418 N Summerfield Loop
- 8363 N Parkside Dr
- 8337 N Parkside Dr
- 8282 N Patriot Ct
Your Personal Tour Guide
Ask me questions while you tour the home.