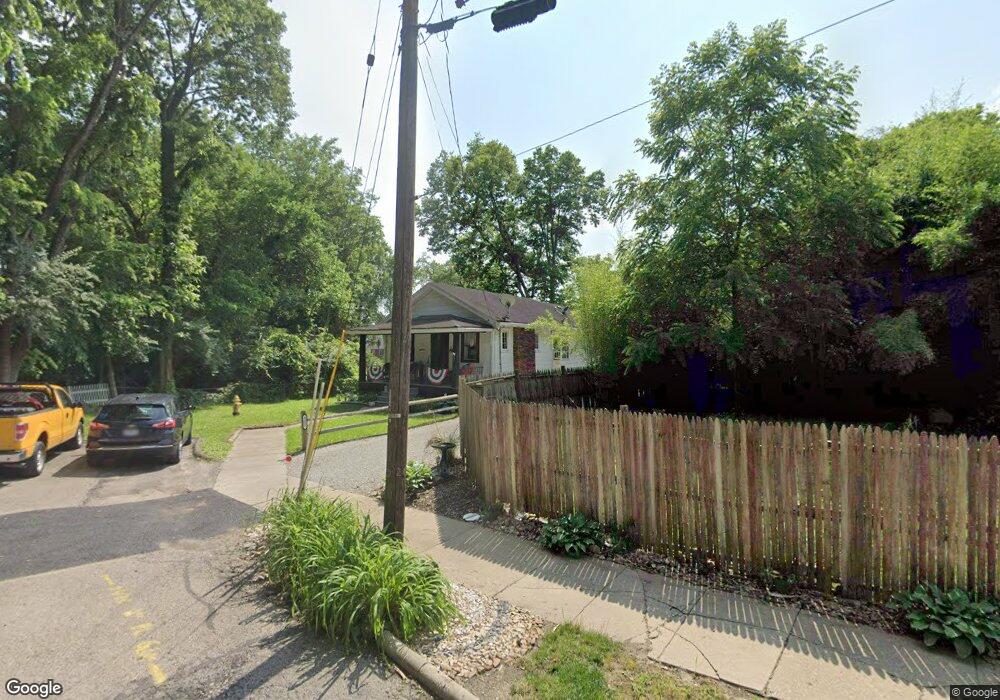
8357 Mace Ave Cincinnati, OH 45216
Hartwell NeighborhoodEstimated Value: $89,000 - $130,000
2
Beds
2
Baths
966
Sq Ft
$121/Sq Ft
Est. Value
About This Home
This home is located at 8357 Mace Ave, Cincinnati, OH 45216 and is currently estimated at $117,001, approximately $121 per square foot. 8357 Mace Ave is a home located in Hamilton County with nearby schools including Rising Stars at Carthage, Hartwell School, and Shroder High School.
Ownership History
Date
Name
Owned For
Owner Type
Purchase Details
Closed on
Mar 21, 2024
Sold by
Burton Shirl L
Bought by
Robbins Jeffrey Paul and Geisen Bessie
Current Estimated Value
Home Financials for this Owner
Home Financials are based on the most recent Mortgage that was taken out on this home.
Original Mortgage
$50,000
Outstanding Balance
$43,168
Interest Rate
6.77%
Mortgage Type
New Conventional
Estimated Equity
$73,833
Purchase Details
Closed on
Sep 30, 2008
Sold by
Fischer James R and Fischer Maxine
Bought by
Burton Shirl L
Home Financials for this Owner
Home Financials are based on the most recent Mortgage that was taken out on this home.
Original Mortgage
$71,236
Interest Rate
6.52%
Mortgage Type
FHA
Purchase Details
Closed on
Jul 24, 1998
Sold by
Taylor Arthur W and Taylor Joanne M
Bought by
Fischer Maxine
Create a Home Valuation Report for This Property
The Home Valuation Report is an in-depth analysis detailing your home's value as well as a comparison with similar homes in the area
Home Values in the Area
Average Home Value in this Area
Purchase History
| Date | Buyer | Sale Price | Title Company |
|---|---|---|---|
| Robbins Jeffrey Paul | $62,500 | None Listed On Document | |
| Burton Shirl L | $72,000 | Stonebridge Land Title Agenc | |
| Fischer Maxine | $49,000 | -- |
Source: Public Records
Mortgage History
| Date | Status | Borrower | Loan Amount |
|---|---|---|---|
| Open | Robbins Jeffrey Paul | $50,000 | |
| Previous Owner | Burton Shirl L | $71,236 |
Source: Public Records
Tax History
| Year | Tax Paid | Tax Assessment Tax Assessment Total Assessment is a certain percentage of the fair market value that is determined by local assessors to be the total taxable value of land and additions on the property. | Land | Improvement |
|---|---|---|---|---|
| 2025 | $1,791 | $28,841 | $7,004 | $21,837 |
| 2023 | $1,777 | $28,841 | $7,004 | $21,837 |
| 2022 | $1,100 | $15,908 | $6,608 | $9,300 |
| 2021 | $1,052 | $15,908 | $6,608 | $9,300 |
| 2020 | $1,082 | $15,908 | $6,608 | $9,300 |
| 2019 | $1,095 | $14,728 | $6,118 | $8,610 |
| 2018 | $1,097 | $14,728 | $6,118 | $8,610 |
| 2017 | $1,042 | $14,728 | $6,118 | $8,610 |
| 2016 | $1,217 | $16,993 | $6,118 | $10,875 |
| 2015 | $1,098 | $16,993 | $6,118 | $10,875 |
| 2014 | $1,106 | $16,993 | $6,118 | $10,875 |
| 2013 | $1,183 | $17,885 | $6,440 | $11,445 |
Source: Public Records
Map
Nearby Homes
- 8421 Wiswell St
- 42 Sheehan Ave
- 8338 Anthony Wayne Ave
- 8318 Marley St
- 342 Durrell Ave
- 29 Hartwell Ct
- 25 Euclid Ave
- 241 Oakmont St
- 177 Burns Ave
- 8081 Woodbine Ave
- 8415 Mayfair St
- 7871 Glenorchard Dr
- 529 Elliott Ave
- 7831 Glen Orchard Dr
- 163 Compton Rd
- 7829 Sunfield Dr
- 1511 Summit Rd
- 1501 Summit Rd
- 1808 Crest Hill Ave
- 701 W Wyoming Ave
Your Personal Tour Guide
Ask me questions while you tour the home.