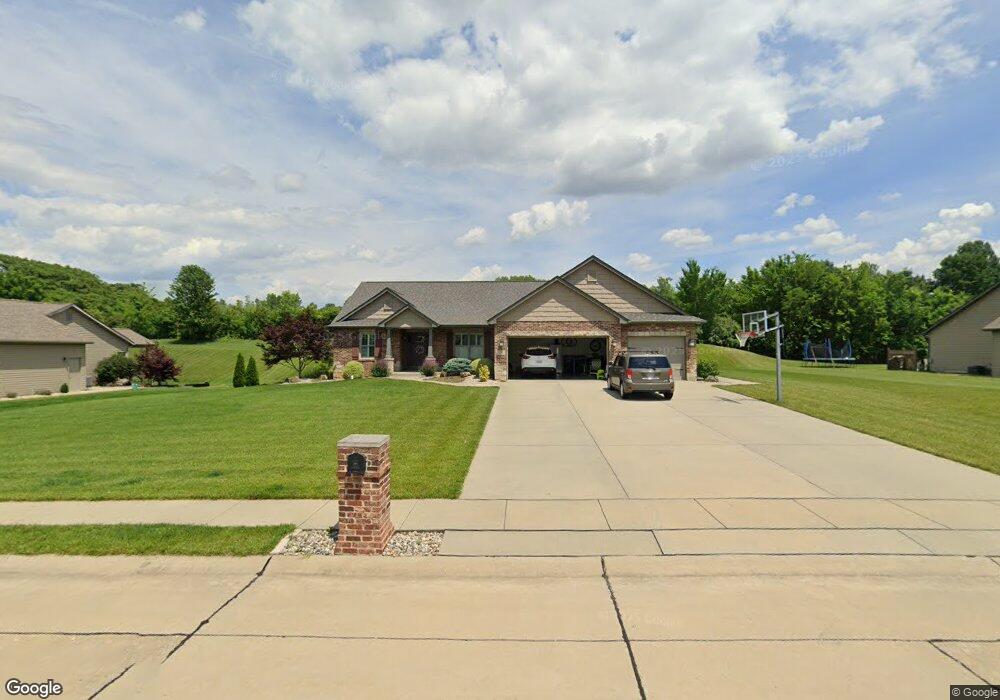
836 Autumn Rise Ln Columbia, IL 62236
Estimated Value: $450,904 - $541,000
--
Bed
--
Bath
1,734
Sq Ft
$286/Sq Ft
Est. Value
About This Home
This home is located at 836 Autumn Rise Ln, Columbia, IL 62236 and is currently estimated at $496,226, approximately $286 per square foot. 836 Autumn Rise Ln is a home located in St. Clair County with nearby schools including Columbia Middle School and Columbia High School.
Ownership History
Date
Name
Owned For
Owner Type
Purchase Details
Closed on
Jun 2, 2020
Sold by
Renieri Sarah E and Renieri Michael J
Bought by
Renieri Revocable Trust
Current Estimated Value
Home Financials for this Owner
Home Financials are based on the most recent Mortgage that was taken out on this home.
Original Mortgage
$332,100
Outstanding Balance
$272,904
Interest Rate
3.25%
Mortgage Type
New Conventional
Estimated Equity
$223,322
Purchase Details
Closed on
Oct 15, 2019
Sold by
Heller Kevin S and Heller Laura L
Bought by
Renieri Revocable Trust
Home Financials for this Owner
Home Financials are based on the most recent Mortgage that was taken out on this home.
Original Mortgage
$329,900
Interest Rate
4%
Mortgage Type
New Conventional
Purchase Details
Closed on
Dec 5, 2013
Sold by
F&F Land Company Llc
Bought by
Heller Kevin S and Heller Laura L
Purchase Details
Closed on
Feb 24, 2010
Sold by
Wab Investments Llc
Bought by
F & F Land Company I Lc
Create a Home Valuation Report for This Property
The Home Valuation Report is an in-depth analysis detailing your home's value as well as a comparison with similar homes in the area
Home Values in the Area
Average Home Value in this Area
Purchase History
| Date | Buyer | Sale Price | Title Company |
|---|---|---|---|
| Renieri Revocable Trust | -- | Accent Title Inc | |
| Srareieri Michael J | -- | Accent Title Inc | |
| Renieri Revocable Trust | $370,000 | Accent Title Inc | |
| Heller Kevin S | $54,000 | Accent Title Inc | |
| F & F Land Company I Lc | $1,380,000 | Town & Country Title Co |
Source: Public Records
Mortgage History
| Date | Status | Borrower | Loan Amount |
|---|---|---|---|
| Open | Srareieri Michael J | $332,100 | |
| Closed | Renieri Revocable Trust | $329,900 |
Source: Public Records
Tax History Compared to Growth
Tax History
| Year | Tax Paid | Tax Assessment Tax Assessment Total Assessment is a certain percentage of the fair market value that is determined by local assessors to be the total taxable value of land and additions on the property. | Land | Improvement |
|---|---|---|---|---|
| 2024 | $7,593 | $111,402 | $19,813 | $91,589 |
| 2023 | $7,438 | $103,514 | $18,410 | $85,104 |
| 2022 | $7,187 | $97,096 | $17,269 | $79,827 |
| 2021 | $6,844 | $91,376 | $16,252 | $75,124 |
| 2020 | $7,109 | $84,825 | $15,998 | $68,827 |
| 2019 | $6,616 | $84,825 | $15,998 | $68,827 |
| 2018 | $6,384 | $80,932 | $15,264 | $65,668 |
| 2017 | $6,058 | $75,207 | $14,184 | $61,023 |
| 2016 | $5,929 | $69,011 | $16,854 | $52,157 |
| 2014 | $1,324 | $33,936 | $299 | $33,637 |
| 2013 | $28 | $306 | $306 | $0 |
Source: Public Records
Map
Nearby Homes
- 1391 Walnut Ridge Dr
- 1374 Walnut Ridge Dr
- 1379 Walnut Ridge Dr
- 1539 Frost Landing
- 527 Fairfax Dr
- 6 Ogle Estates
- 1 Ogle Estates
- 3 Ogle Estates
- 5 Ogle Estates
- 7 Ogle Estates
- 4 Ogle Estates
- 420 Micahs Way
- 209 Heritage St
- 221 E Crestview Dr
- 817 N Briegel St
- 2838 Robert Dr
- 2846 Robert Dr
- 305 Fox Run Dr
- 2620 Brookfield Ct
- 0 Timber Rock Lot 5 Unit MAR24052087
- 840 Autumn Rise Ln
- 832 Autumn Rise Ln
- 835 Autumn Rise Ln
- 844 Autumn Rise Ln
- 828 Autumn Rise Ln
- 831 Autumn Rise Ln
- 839 Autumn Rise Ln
- 827 Autumn Rise Ln
- 843 Autumn Rise Ln
- 824 Autumn Rise Ln
- 848 Autumn Rise Ln
- 823 Autumn Rise Ln
- 816 Briar Lake Place
- 820 Autumn Rise Ln
- 847 Autumn Rise Ln
- 820 Briar Lake Place
- 852 Autumn Rise Ln
- 815 Autumn Rise Ln
- 816 Autumn Rise Ln
- 824 Briar Lake Place