Estimated Value: $483,585 - $491,000
--
Bed
--
Bath
--
Sq Ft
7,841
Sq Ft Lot
About This Home
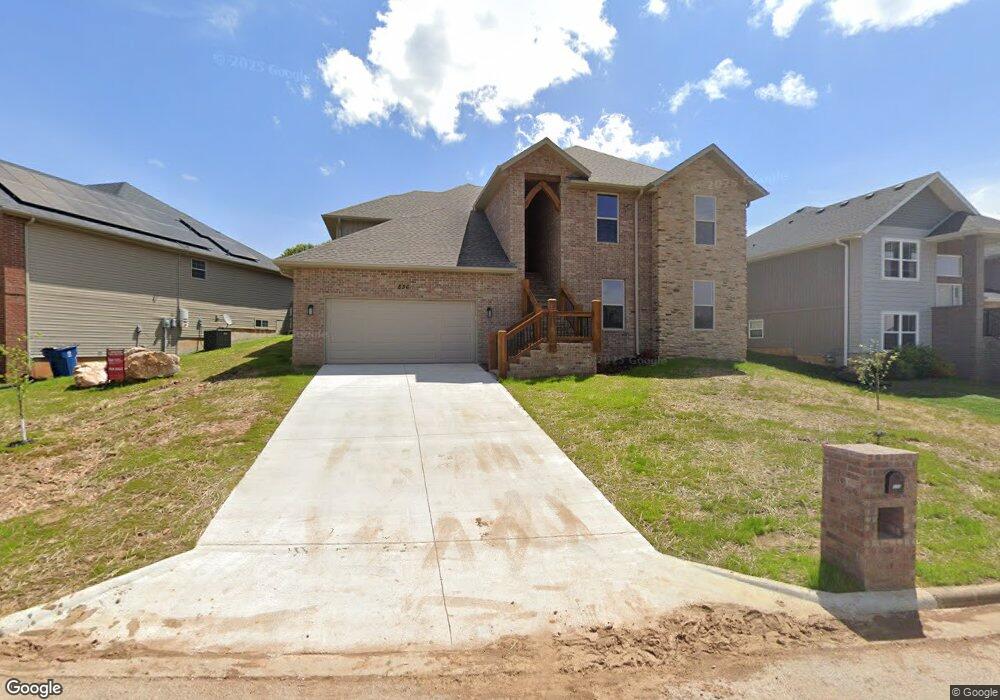
This home is located at 836 Black Sands, Nixa, MO 65714 and is currently estimated at $486,896. 836 Black Sands is a home located in Christian County with nearby schools including Deauville Gardens Elementary School, Hugh W. Gregg Elementary School, and Century Elementary School.
Ownership History
Date
Name
Owned For
Owner Type
Purchase Details
Closed on
Mar 10, 2022
Sold by
Castaneda Kimberly A and Castaneda Daniel
Bought by
Bewley Construction Llc
Current Estimated Value
Home Financials for this Owner
Home Financials are based on the most recent Mortgage that was taken out on this home.
Original Mortgage
$428,000
Outstanding Balance
$399,890
Interest Rate
3.92%
Mortgage Type
Construction
Estimated Equity
$87,006
Purchase Details
Closed on
Dec 27, 2014
Sold by
Apted Betty J
Bought by
Castaneda Kimberly A
Purchase Details
Closed on
Sep 5, 2014
Sold by
Great Southern Bank
Bought by
Apted Betty J
Create a Home Valuation Report for This Property
The Home Valuation Report is an in-depth analysis detailing your home's value as well as a comparison with similar homes in the area
Home Values in the Area
Average Home Value in this Area
Purchase History
| Date | Buyer | Sale Price | Title Company |
|---|---|---|---|
| Bewley Construction Llc | -- | None Listed On Document | |
| Castaneda Kimberly A | -- | None Available | |
| Apted Betty J | -- | Hogan Land Title Company |
Source: Public Records
Mortgage History
| Date | Status | Borrower | Loan Amount |
|---|---|---|---|
| Open | Bewley Construction Llc | $428,000 |
Source: Public Records
Tax History Compared to Growth
Tax History
| Year | Tax Paid | Tax Assessment Tax Assessment Total Assessment is a certain percentage of the fair market value that is determined by local assessors to be the total taxable value of land and additions on the property. | Land | Improvement |
|---|---|---|---|---|
| 2024 | $414 | $90,550 | -- | -- |
| 2023 | $414 | $6,650 | $0 | $0 |
| 2022 | $285 | $4,560 | $0 | $0 |
| 2021 | $285 | $4,560 | $0 | $0 |
| 2020 | $298 | $4,560 | $0 | $0 |
| 2019 | $298 | $4,560 | $0 | $0 |
| 2018 | $278 | $4,560 | $0 | $0 |
| 2017 | $278 | $4,560 | $0 | $0 |
| 2016 | $274 | $4,560 | $0 | $0 |
| 2015 | $305 | $4,560 | $4,560 | $0 |
Source: Public Records
Map
Nearby Homes
- 836 S Black Sands Ave
- 845 S Black Sands
- 843 S Black Sands Ave Unit Lot 115
- 825 S Cobble Creek Blvd
- 846 S Cobble Creek Blvd
- 718 River Rock Ct
- 822 S Eastridge
- 844 S Parkside Cir
- 945 S Ozark Rd
- 827 S Ridgemont Dr Unit Lot 211
- 826 S Ridgemont Dr Unit Lot 145
- 824 S Ridgemont Dr Unit Lot 144
- 828 S Ridgemont Dr Unit Lot 146
- 859 E Acacia Ln
- 116 E Acacia Ln
- 120 E Acacia Ln
- 106 E Acacia Ln
- 723 S Oak Terrace Dr
- 870 E Virginia Ln Unit Lot 152
- 854 E Virginia Ln Unit Lot 208
- 838 Black Sands
- 834 S Black Sands
- 838 S Black Sands Ave
- 712 E Mining Camp Rd
- 712 E Mining Camp Rd
- Lot 121 Black Sands
- Lot 112 Black Sands
- Lot 120 Black Sands
- Lot 115 Black Sands
- Lot 122 Black Sands
- Lot 123 Black Sands
- Lot 117 Black Sands
- Lot 116 Black Sands
- Lot 114 Black Sands
- Lot 113 Black Sands
- 839 Black Sands
- 845 Black Sands
- 841 Black Sands
- 847 Black Sands
- 843 Black Sands