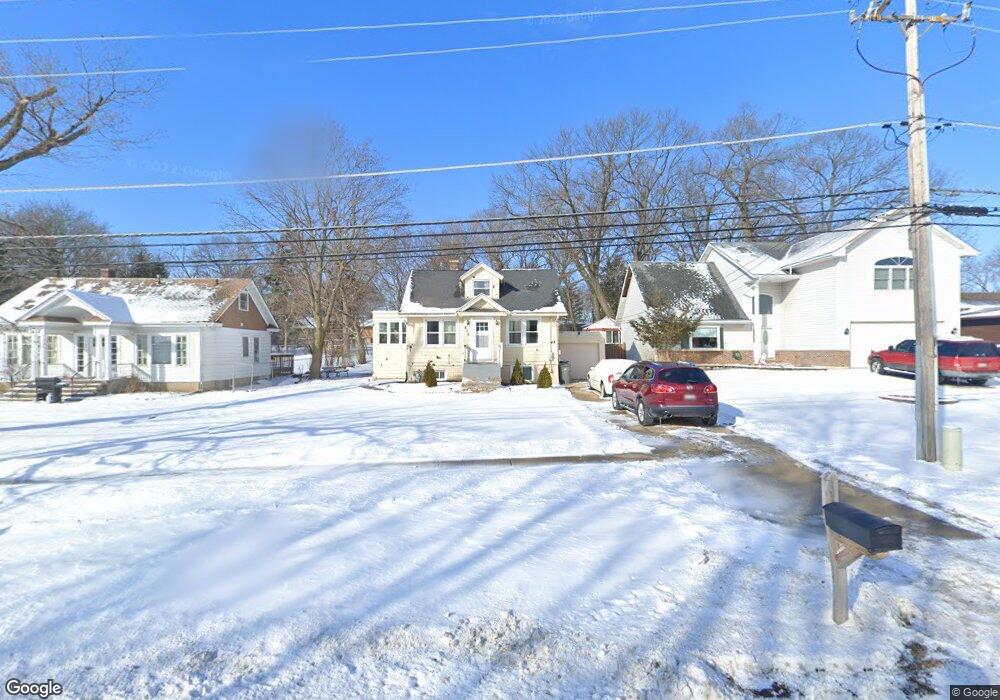
836 Bode Rd Elgin, IL 60120
Lords Park NeighborhoodEstimated Value: $240,000 - $299,000
3
Beds
3
Baths
1,014
Sq Ft
$273/Sq Ft
Est. Value
About This Home
This home is located at 836 Bode Rd, Elgin, IL 60120 and is currently estimated at $276,887, approximately $273 per square foot. 836 Bode Rd is a home located in Cook County with nearby schools including Lords Park Elementary School, Ellis Middle School, and Elgin High School.
Ownership History
Date
Name
Owned For
Owner Type
Purchase Details
Closed on
Jun 17, 2016
Sold by
Hall Salina M
Bought by
D3 Home Solutions Llc
Current Estimated Value
Purchase Details
Closed on
Mar 13, 2007
Sold by
Batway Marc C and Lewis Jenni L
Bought by
Hall Salina M and Conley Linda M
Home Financials for this Owner
Home Financials are based on the most recent Mortgage that was taken out on this home.
Original Mortgage
$195,242
Interest Rate
6.19%
Mortgage Type
Unknown
Purchase Details
Closed on
Jun 3, 2005
Sold by
Fallert Caryl J
Bought by
Batway Marc C and Lewis Jenni L
Home Financials for this Owner
Home Financials are based on the most recent Mortgage that was taken out on this home.
Original Mortgage
$117,000
Interest Rate
7%
Mortgage Type
Unknown
Purchase Details
Closed on
Nov 24, 2004
Sold by
Bryer Cecil J
Bought by
Bryer Cecil J and The Cecil J Bryer Trust #1
Purchase Details
Closed on
Aug 19, 1994
Sold by
Bryer Cecil J and Bryer Pauline E
Bought by
Bryer Cecil J and Cecil J Bryer Trust #1
Create a Home Valuation Report for This Property
The Home Valuation Report is an in-depth analysis detailing your home's value as well as a comparison with similar homes in the area
Home Values in the Area
Average Home Value in this Area
Purchase History
| Date | Buyer | Sale Price | Title Company |
|---|---|---|---|
| D3 Home Solutions Llc | $70,500 | Attorney | |
| Hall Salina M | $198,000 | Lawyers Title Insurance Corp | |
| Batway Marc C | $130,000 | Chicago Title Insurance Comp | |
| Bryer Cecil J | -- | -- | |
| Bryer Cecil J | -- | -- | |
| Bryer Cecil J | -- | -- |
Source: Public Records
Mortgage History
| Date | Status | Borrower | Loan Amount |
|---|---|---|---|
| Previous Owner | Hall Salina M | $195,242 | |
| Previous Owner | Batway Marc C | $117,000 |
Source: Public Records
Tax History
| Year | Tax Paid | Tax Assessment Tax Assessment Total Assessment is a certain percentage of the fair market value that is determined by local assessors to be the total taxable value of land and additions on the property. | Land | Improvement |
|---|---|---|---|---|
| 2025 | $3,463 | $27,000 | $5,227 | $21,773 |
| 2024 | $3,463 | $18,000 | $7,841 | $10,159 |
| 2023 | $3,313 | $18,000 | $7,841 | $10,159 |
| 2022 | $3,313 | $18,000 | $7,841 | $10,159 |
| 2021 | $2,880 | $14,351 | $5,553 | $8,798 |
| 2020 | $3,002 | $14,351 | $5,553 | $8,798 |
| 2019 | $3,050 | $16,125 | $5,553 | $10,572 |
| 2018 | $2,517 | $13,593 | $4,900 | $8,693 |
| 2017 | $4,604 | $13,593 | $4,900 | $8,693 |
| 2016 | $3,536 | $13,593 | $4,900 | $8,693 |
| 2015 | $3,598 | $12,863 | $4,573 | $8,290 |
| 2014 | $3,503 | $12,863 | $4,573 | $8,290 |
| 2013 | $3,368 | $12,863 | $4,573 | $8,290 |
Source: Public Records
Map
Nearby Homes
- 833 Forest Ave
- 1002 Bruce Dr
- 335 Shiloh Ln
- 149 Highbury Dr
- 899 Carl Ave
- 115 N Porter St
- 523 Preston Ave
- 445 Lucile Ave
- 130 Stonehurst Dr
- 453 Addison St
- 450 Villa St
- 1154 Pegwood Dr
- 330 Buckingham Cir Unit C
- 1089 Quaker Hill Ct Unit 711
- 483 Barrett St
- 385 Woodview Cir Unit B
- 131 N Gifford St
- 683 Columbia Ave
- 332-334 St Charles St
- 513 Cookane Ave
- 832 Bode Rd
- 840 Bode Rd
- 830 Bode Rd
- 842 Bode Rd
- 828 Bode Rd
- 844 Bode Rd
- 837 Forest Ave
- 831 Bode Rd
- 821 Bode Rd Unit 7
- 821 Bode Rd Unit 9
- 821 Bode Rd Unit 10
- 821 Bode Rd Unit 1
- 821 Bode Rd Unit 13
- 821 Bode Rd Unit 2
- 821 Bode Rd Unit 3
- 821 Bode Rd Unit 12
- 821 Bode Rd Unit 16
- 821 Bode Rd Unit 5
- 821 Bode Rd Unit 4
- 821 Bode Rd Unit 6
Your Personal Tour Guide
Ask me questions while you tour the home.