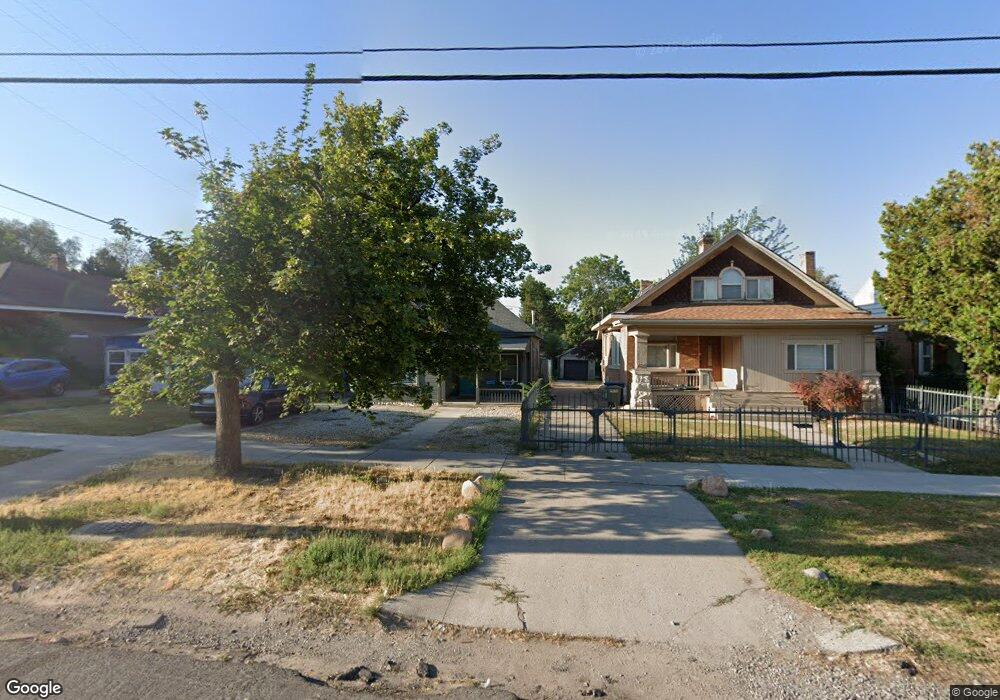
836 E 600 S Salt Lake City, UT 84102
East Central NeighborhoodEstimated Value: $438,000 - $559,000
2
Beds
1
Bath
756
Sq Ft
$643/Sq Ft
Est. Value
About This Home
This home is located at 836 E 600 S, Salt Lake City, UT 84102 and is currently estimated at $485,939, approximately $642 per square foot. 836 E 600 S is a home located in Salt Lake County with nearby schools including Bennion Elementary School, Wasatch Elementary School, and East High School.
Ownership History
Date
Name
Owned For
Owner Type
Purchase Details
Closed on
Dec 21, 2005
Sold by
Lupine Enterprises Inc
Bought by
Mihaila Radu T and Mihaila Masaki Y
Current Estimated Value
Home Financials for this Owner
Home Financials are based on the most recent Mortgage that was taken out on this home.
Original Mortgage
$132,000
Outstanding Balance
$71,466
Interest Rate
5.75%
Mortgage Type
Unknown
Estimated Equity
$414,473
Purchase Details
Closed on
Sep 22, 2005
Sold by
Fannie Mae
Bought by
Lupine Enterprises Inc
Purchase Details
Closed on
Jun 23, 2005
Sold by
Stringfellow Burton R and Stringfellow Carol H
Bought by
Federal National Mortgage Association
Purchase Details
Closed on
May 27, 2003
Sold by
Kapteyn Caron Self
Bought by
Stringfellow Burton R and Stringfellow Carol H
Home Financials for this Owner
Home Financials are based on the most recent Mortgage that was taken out on this home.
Original Mortgage
$64,000
Interest Rate
5.75%
Mortgage Type
Seller Take Back
Purchase Details
Closed on
Nov 19, 1996
Sold by
Kapteyn Caron Self
Bought by
Self Curtis W
Create a Home Valuation Report for This Property
The Home Valuation Report is an in-depth analysis detailing your home's value as well as a comparison with similar homes in the area
Home Values in the Area
Average Home Value in this Area
Purchase History
| Date | Buyer | Sale Price | Title Company |
|---|---|---|---|
| Mihaila Radu T | -- | Landmark Title | |
| Lupine Enterprises Inc | $118,000 | United Title Services | |
| Federal National Mortgage Association | $101,802 | -- | |
| Stringfellow Burton R | -- | First American Title | |
| Self Curtis W | -- | -- |
Source: Public Records
Mortgage History
| Date | Status | Borrower | Loan Amount |
|---|---|---|---|
| Open | Mihaila Radu T | $132,000 | |
| Previous Owner | Stringfellow Burton R | $64,000 |
Source: Public Records
Tax History Compared to Growth
Tax History
| Year | Tax Paid | Tax Assessment Tax Assessment Total Assessment is a certain percentage of the fair market value that is determined by local assessors to be the total taxable value of land and additions on the property. | Land | Improvement |
|---|---|---|---|---|
| 2025 | $2,233 | $451,500 | $168,500 | $283,000 |
| 2024 | $2,233 | $426,100 | $159,400 | $266,700 |
| 2023 | $2,220 | $408,300 | $165,700 | $242,600 |
| 2022 | $2,385 | $411,600 | $162,400 | $249,200 |
| 2021 | $1,749 | $273,200 | $122,700 | $150,500 |
| 2020 | $1,691 | $251,400 | $115,500 | $135,900 |
| 2019 | $1,721 | $240,800 | $106,100 | $134,700 |
| 2018 | $1,633 | $222,500 | $106,100 | $116,400 |
| 2017 | $1,717 | $219,200 | $106,100 | $113,100 |
| 2016 | $1,655 | $200,600 | $67,100 | $133,500 |
| 2015 | $1,595 | $183,200 | $69,100 | $114,100 |
| 2014 | $1,544 | $176,000 | $67,800 | $108,200 |
Source: Public Records
Map
Nearby Homes
- 606 S 900 E
- 538 S 800 E
- 915 E 600 S
- 531 S 900 E Unit B3
- 504 S 900 E
- 717 S 800 E
- 543 S 900 E Unit A11
- 827 E 500 S
- 525 S 900 E Unit B2
- 938 E Lowell Ave
- 515 S 1000 E Unit 706
- 515 S 1000 E Unit 406
- 515 S 1000 E Unit 1104
- 515 S 1000 E Unit 504
- 552 S Mcclelland St
- 551 S Mcclelland St
- 426 S 1000 E Unit 600
- 426 S 1000 E Unit 707
- 1011 E 800 S
- 1021 E 800 S