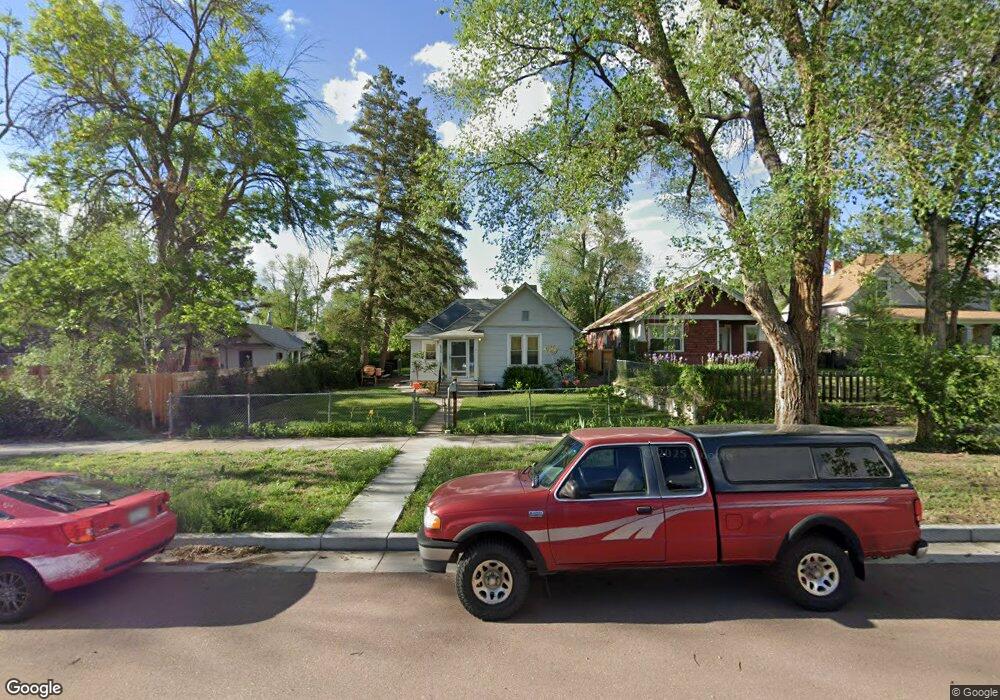
836 E Moreno Ave Colorado Springs, CO 80903
Hillside/East Lake NeighborhoodEstimated Value: $341,000 - $349,768
1
Bed
1
Bath
884
Sq Ft
$392/Sq Ft
Est. Value
About This Home
This home is located at 836 E Moreno Ave, Colorado Springs, CO 80903 and is currently estimated at $346,192, approximately $391 per square foot. 836 E Moreno Ave is a home located in El Paso County with nearby schools including Adams Elementary School, North Middle School, and William J. Palmer High School.
Ownership History
Date
Name
Owned For
Owner Type
Purchase Details
Closed on
Oct 18, 2006
Sold by
Cascade Associates Inc
Bought by
Porter Michael E
Current Estimated Value
Home Financials for this Owner
Home Financials are based on the most recent Mortgage that was taken out on this home.
Original Mortgage
$108,500
Outstanding Balance
$64,744
Interest Rate
6.46%
Mortgage Type
Unknown
Estimated Equity
$281,448
Purchase Details
Closed on
Jun 8, 2006
Sold by
Higgins Kathy J
Bought by
The Cascade Associates Inc
Home Financials for this Owner
Home Financials are based on the most recent Mortgage that was taken out on this home.
Original Mortgage
$82,710
Interest Rate
6.56%
Mortgage Type
Unknown
Purchase Details
Closed on
Apr 18, 2002
Sold by
Cooley Nettie Charlotte
Bought by
Higgins Kathy J and Cooley Nettie Charlotte
Create a Home Valuation Report for This Property
The Home Valuation Report is an in-depth analysis detailing your home's value as well as a comparison with similar homes in the area
Home Values in the Area
Average Home Value in this Area
Purchase History
| Date | Buyer | Sale Price | Title Company |
|---|---|---|---|
| Porter Michael E | $118,500 | Title America | |
| The Cascade Associates Inc | $80,000 | Title America | |
| Higgins Kathy J | -- | Title America | |
| Higgins Kathy J | -- | -- |
Source: Public Records
Mortgage History
| Date | Status | Borrower | Loan Amount |
|---|---|---|---|
| Open | Porter Michael E | $108,500 | |
| Previous Owner | The Cascade Associates Inc | $82,710 |
Source: Public Records
Tax History Compared to Growth
Tax History
| Year | Tax Paid | Tax Assessment Tax Assessment Total Assessment is a certain percentage of the fair market value that is determined by local assessors to be the total taxable value of land and additions on the property. | Land | Improvement |
|---|---|---|---|---|
| 2025 | $1,111 | $24,570 | -- | -- |
| 2024 | $1,000 | $24,390 | $3,510 | $20,880 |
| 2022 | $801 | $14,310 | $3,250 | $11,060 |
| 2021 | $869 | $14,720 | $3,350 | $11,370 |
| 2020 | $795 | $11,710 | $2,570 | $9,140 |
| 2019 | $790 | $11,710 | $2,570 | $9,140 |
| 2018 | $630 | $8,580 | $1,940 | $6,640 |
| 2017 | $596 | $8,580 | $1,940 | $6,640 |
| 2016 | $461 | $7,960 | $1,790 | $6,170 |
| 2015 | $460 | $7,960 | $1,790 | $6,170 |
| 2014 | $448 | $7,440 | $1,670 | $5,770 |
Source: Public Records
Map
Nearby Homes
- 529 S Prospect St
- 917 E Cimarron St
- 944 E Moreno Ave Unit A & B
- 909 E Costilla St
- 801 E Costilla St
- 947 E Costilla St
- 1015 E Moreno Ave
- 703 E Costilla St
- 1023 E Costilla St
- 725 E Las Animas St
- 735 E Vermijo Ave
- 832 E Vermijo Ave
- 1028 E Costilla St
- 1113 E Cimarron St
- 906 S Institute St
- 1017 E Las Animas St
- 909 S Arcadia St
- 314 S El Paso St
- 1119 E Rio Grande St
- 310 S El Paso St
- 838 E Moreno Ave
- 830 E Moreno Ave
- 842 E Moreno Ave
- 826 E Moreno Ave
- 824 E Moreno Ave
- 524 S Institute St
- 848 E Moreno Ave
- 518 S Institute St
- 820 E Moreno Ave
- 835 E Cimarron St
- 839 E Cimarron St
- 831 E Cimarron St
- 514 S Institute St
- 843 E Cimarron St
- 825 E Cimarron St Unit 827
- 816 E Moreno Ave
- 823 E Cimarron St
- 829 E Moreno Ave
- 839 E Moreno Ave
- 825 E Moreno Ave