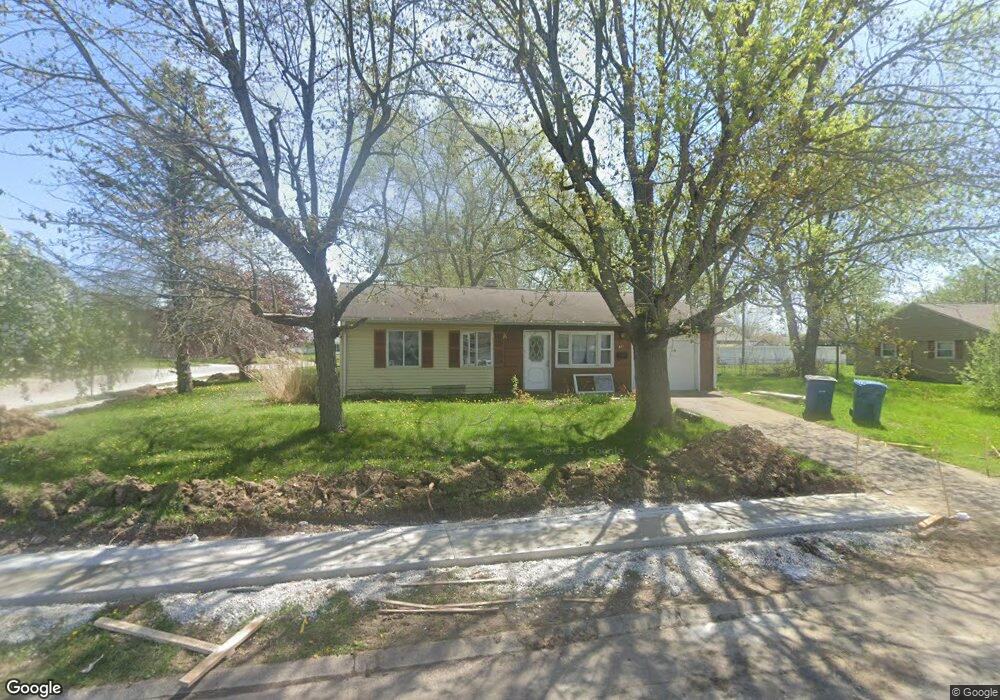
836 Eastmont Dr Gas City, IN 46933
Estimated Value: $109,000 - $132,940
3
Beds
1
Bath
992
Sq Ft
$125/Sq Ft
Est. Value
About This Home
This home is located at 836 Eastmont Dr, Gas City, IN 46933 and is currently estimated at $124,235, approximately $125 per square foot. 836 Eastmont Dr is a home located in Grant County with nearby schools including Westview Elementary School, Northview Elementary School, and R.J. Baskett Middle School.
Ownership History
Date
Name
Owned For
Owner Type
Purchase Details
Closed on
Dec 4, 2020
Sold by
Nash Jeremy M and Cole Stacie L
Bought by
Bailey Nathan L
Current Estimated Value
Home Financials for this Owner
Home Financials are based on the most recent Mortgage that was taken out on this home.
Original Mortgage
$77,569
Outstanding Balance
$69,060
Interest Rate
2.7%
Mortgage Type
FHA
Estimated Equity
$55,175
Purchase Details
Closed on
Jul 30, 2003
Sold by
Not Provided
Bought by
Not Provided
Create a Home Valuation Report for This Property
The Home Valuation Report is an in-depth analysis detailing your home's value as well as a comparison with similar homes in the area
Home Values in the Area
Average Home Value in this Area
Purchase History
| Date | Buyer | Sale Price | Title Company |
|---|---|---|---|
| Bailey Nathan L | -- | None Available | |
| Not Provided | $64,999 | -- |
Source: Public Records
Mortgage History
| Date | Status | Borrower | Loan Amount |
|---|---|---|---|
| Open | Bailey Nathan L | $77,569 |
Source: Public Records
Tax History Compared to Growth
Tax History
| Year | Tax Paid | Tax Assessment Tax Assessment Total Assessment is a certain percentage of the fair market value that is determined by local assessors to be the total taxable value of land and additions on the property. | Land | Improvement |
|---|---|---|---|---|
| 2024 | $777 | $101,800 | $20,500 | $81,300 |
| 2023 | $693 | $96,400 | $20,500 | $75,900 |
| 2022 | $551 | $83,100 | $17,300 | $65,800 |
| 2021 | $1,446 | $72,300 | $17,300 | $55,000 |
| 2020 | $376 | $70,100 | $17,300 | $52,800 |
| 2019 | $350 | $66,700 | $17,300 | $49,400 |
| 2018 | $316 | $64,900 | $17,300 | $47,600 |
| 2017 | $300 | $63,300 | $17,300 | $46,000 |
| 2016 | $295 | $65,500 | $17,300 | $48,200 |
| 2014 | $239 | $60,700 | $17,300 | $43,400 |
| 2013 | $239 | $55,300 | $12,100 | $43,200 |
Source: Public Records
Map
Nearby Homes
- 217 N 10th St
- 809 E North F St
- 1131a E Main St
- 1054 Long Branch Ct
- 1207 Trace Ave
- 1205 Trace Ave
- 521 E North A St
- 66 Cobblestone Blvd
- 20 Cobblestone Blvd
- 614 E South A St
- 408 Walnut Dr
- 0 County Road 425 S
- 312 E North C St
- 416 E South C St
- 624 E South F St
- 223 E North A St
- 313 E South B St
- 416 E South D St
- 214 Locust Dr
- 408 E South D St