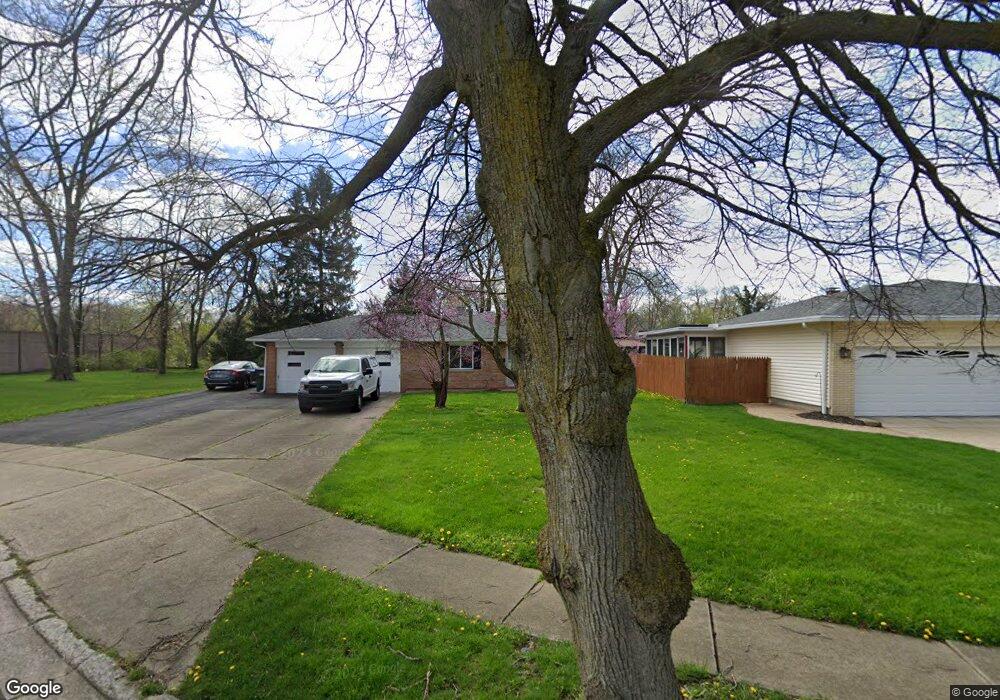
836 Hollywood Cir Unit 838 Cuyahoga Falls, OH 44221
Mud Brook NeighborhoodEstimated Value: $224,000 - $263,341
4
Beds
2
Baths
1,740
Sq Ft
$144/Sq Ft
Est. Value
About This Home
This home is located at 836 Hollywood Cir Unit 838, Cuyahoga Falls, OH 44221 and is currently estimated at $250,585, approximately $144 per square foot. 836 Hollywood Cir Unit 838 is a home located in Summit County with nearby schools including Lincoln Elementary School, Roberts Middle School, and Cuyahoga Falls High School.
Ownership History
Date
Name
Owned For
Owner Type
Purchase Details
Closed on
Jul 27, 2023
Sold by
Gould George Hubbard
Bought by
Bodjanac Travis
Current Estimated Value
Home Financials for this Owner
Home Financials are based on the most recent Mortgage that was taken out on this home.
Original Mortgage
$210,000
Outstanding Balance
$205,107
Interest Rate
6.69%
Mortgage Type
VA
Estimated Equity
$45,478
Purchase Details
Closed on
Jul 24, 2023
Sold by
Gould George Hubbard
Bought by
Bodjanac Travis
Home Financials for this Owner
Home Financials are based on the most recent Mortgage that was taken out on this home.
Original Mortgage
$210,000
Outstanding Balance
$205,107
Interest Rate
6.69%
Mortgage Type
VA
Estimated Equity
$45,478
Purchase Details
Closed on
Sep 22, 2012
Sold by
Gould George Hubbard
Bought by
Govid Gorce Hubbard and Govid Louise Tane
Create a Home Valuation Report for This Property
The Home Valuation Report is an in-depth analysis detailing your home's value as well as a comparison with similar homes in the area
Home Values in the Area
Average Home Value in this Area
Purchase History
| Date | Buyer | Sale Price | Title Company |
|---|---|---|---|
| Bodjanac Travis | $210,000 | None Listed On Document | |
| Bodjanac Travis | $210,000 | None Listed On Document | |
| Govid Gorce Hubbard | -- | None Available |
Source: Public Records
Mortgage History
| Date | Status | Borrower | Loan Amount |
|---|---|---|---|
| Open | Bodjanac Travis | $210,000 | |
| Closed | Bodjanac Travis | $210,000 |
Source: Public Records
Tax History Compared to Growth
Tax History
| Year | Tax Paid | Tax Assessment Tax Assessment Total Assessment is a certain percentage of the fair market value that is determined by local assessors to be the total taxable value of land and additions on the property. | Land | Improvement |
|---|---|---|---|---|
| 2025 | $4,338 | $78,569 | $18,442 | $60,127 |
| 2024 | $4,338 | $78,569 | $18,442 | $60,127 |
| 2023 | $4,338 | $78,569 | $18,442 | $60,127 |
| 2022 | $3,840 | $56,522 | $13,265 | $43,257 |
| 2021 | $3,840 | $56,522 | $13,265 | $43,257 |
| 2020 | $3,779 | $56,530 | $13,270 | $43,260 |
| 2019 | $4,102 | $55,900 | $15,160 | $40,740 |
| 2018 | $3,497 | $55,900 | $15,160 | $40,740 |
| 2017 | $3,244 | $55,900 | $15,160 | $40,740 |
| 2016 | $3,246 | $52,440 | $15,160 | $37,280 |
| 2015 | $3,244 | $52,440 | $15,160 | $37,280 |
| 2014 | $3,245 | $52,440 | $15,160 | $37,280 |
| 2013 | $3,218 | $52,440 | $15,160 | $37,280 |
Source: Public Records
Map
Nearby Homes
- 3044 Millboro Rd
- Greenfield Plan at Miller's Landing
- Riverton Plan at Miller's Landing
- Woodside Plan at Miller's Landing
- Willwood Plan at Miller's Landing
- Westchester Plan at Miller's Landing
- Amberwood Plan at Miller's Landing
- Hilltop Plan at Miller's Landing
- 2950 Millboro Rd
- 435 Roanoke Ave
- 3320 Hudson Dr
- 306 Hollywood Ave
- 2934 Silver Lake Blvd
- 455 Marguerite Ave
- 3675 Country Club Dr
- 2870 Kent Rd
- 419 Keenan Ave
- 2886 Norwood St
- 2872 Silver Lake Blvd
- 2834 Norwood St
- 836 Hollywood Cir
- 830 Hollywood Cir
- 842 Hollywood Cir Unit 844
- 824 Hollywood Cir
- 3215 Saunders St
- 3211 Saunders St
- 818 Hollywood Cir
- 837 Hollywood Cir
- 835 Hollywood Cir
- 3207 Saunders St
- 835 Hollywood Cir Unit 837
- 841 Hollywood Cir Unit 843
- 816 Hollywood Cir
- 829 Hollywood Cir
- 823 Hollywood Cir
- 3210 Saunders St
- 3203 Saunders St
- 817 Hollywood Cir Unit 819
- 3206 Saunders St
- 3315 Charles St