836 Lenox Rd Brooklyn, NY 11203
East Flatbush NeighborhoodEstimated Value: $729,000 - $1,261,000
Studio
--
Bath
2,448
Sq Ft
$386/Sq Ft
Est. Value
About This Home
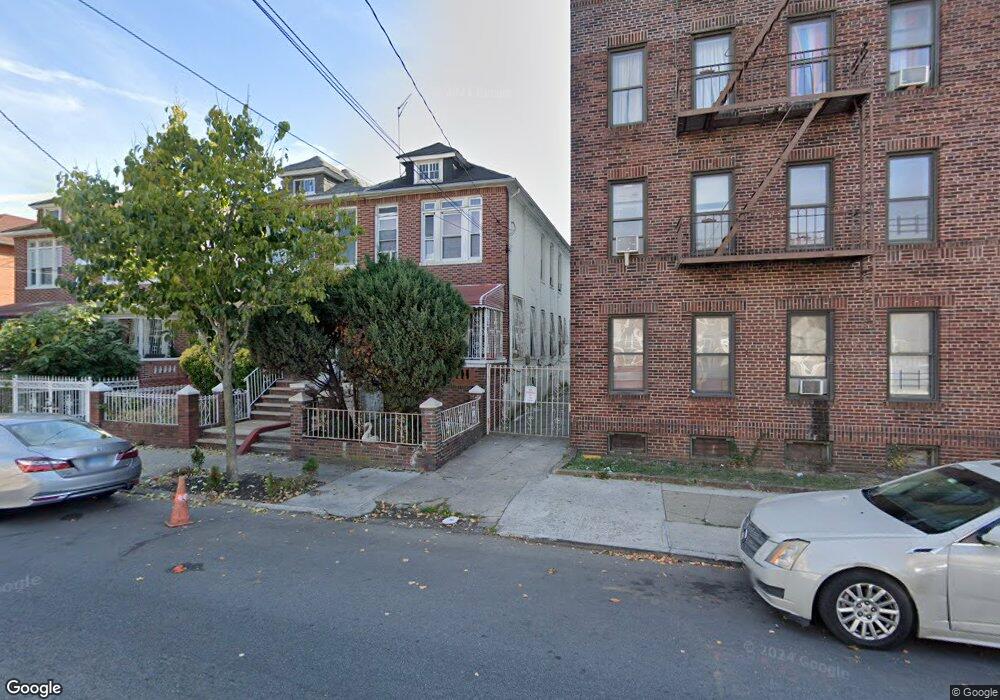
This home is located at 836 Lenox Rd, Brooklyn, NY 11203 and is currently estimated at $945,244, approximately $386 per square foot. 836 Lenox Rd is a home located in Kings County with nearby schools including P.S. 268 Emma Lazarus, East Flatbush Community Research School, and Brooklyn Ascend Charter School.
Ownership History
Date
Name
Owned For
Owner Type
Purchase Details
Closed on
Mar 26, 2012
Sold by
Charles Wanda
Bought by
Andre Belinda and Andre Charles Wanda
Current Estimated Value
Home Financials for this Owner
Home Financials are based on the most recent Mortgage that was taken out on this home.
Original Mortgage
$205,000
Interest Rate
3.88%
Mortgage Type
New Conventional
Purchase Details
Closed on
Mar 15, 2007
Sold by
Andre Belinda and Blakey Andre
Bought by
Charles Wanda
Create a Home Valuation Report for This Property
The Home Valuation Report is an in-depth analysis detailing your home's value as well as a comparison with similar homes in the area
Home Values in the Area
Average Home Value in this Area
Purchase History
| Date | Buyer | Sale Price | Title Company |
|---|---|---|---|
| Andre Belinda | -- | -- | |
| Andre Belinda | -- | -- | |
| Charles Wanda | -- | -- | |
| Charles Wanda | -- | -- |
Source: Public Records
Mortgage History
| Date | Status | Borrower | Loan Amount |
|---|---|---|---|
| Previous Owner | Andre Belinda | $205,000 | |
| Closed | Charles Wanda | $0 |
Source: Public Records
Tax History
| Year | Tax Paid | Tax Assessment Tax Assessment Total Assessment is a certain percentage of the fair market value that is determined by local assessors to be the total taxable value of land and additions on the property. | Land | Improvement |
|---|---|---|---|---|
| 2025 | $5,814 | $56,460 | $20,940 | $35,520 |
| 2024 | $5,814 | $46,140 | $20,940 | $25,200 |
| 2023 | $5,552 | $47,280 | $20,940 | $26,340 |
| 2022 | $4,862 | $38,700 | $20,940 | $17,760 |
| 2021 | $4,832 | $35,220 | $20,940 | $14,280 |
| 2020 | $2,401 | $40,260 | $20,940 | $19,320 |
| 2019 | $4,754 | $40,260 | $20,940 | $19,320 |
| 2018 | $4,346 | $22,780 | $15,996 | $6,784 |
| 2017 | $4,082 | $21,496 | $13,115 | $8,381 |
| 2016 | $3,749 | $20,304 | $14,918 | $5,386 |
| 2015 | $2,226 | $20,304 | $13,902 | $6,402 |
| 2014 | $2,226 | $20,104 | $12,087 | $8,017 |
Source: Public Records
Map
Nearby Homes
- 206 E 53rd St
- 828 Lenox Rd
- 814 Linden Blvd
- 197 E 52nd St
- 243 E 51st St
- 895 Lenox Rd
- 343 E 51st St
- 234 E 54th St
- 871 Linden Blvd
- 355 E 51st St
- 175 E 55th St
- 886 Linden Blvd Unit 888
- 76 E 54th St
- 5319 Church Ave
- 52 E 55th St Unit 2FAM
- 317 E 49th St Unit 2
- 890 Linden Blvd
- 891 Linden Blvd
- 61 E 54th St
- 27 E 56th St
Your Personal Tour Guide
Ask me questions while you tour the home.