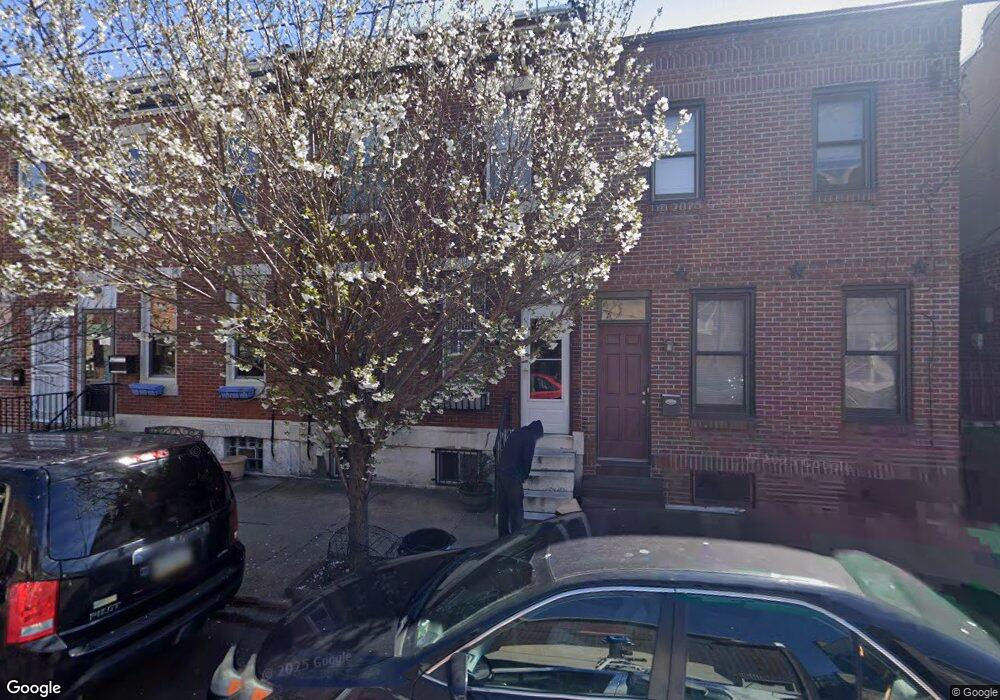
836 Morris St Philadelphia, PA 19148
East Passyunk NeighborhoodEstimated Value: $304,000 - $358,000
3
Beds
2
Baths
1,190
Sq Ft
$278/Sq Ft
Est. Value
About This Home
This home is located at 836 Morris St, Philadelphia, PA 19148 and is currently estimated at $330,807, approximately $277 per square foot. 836 Morris St is a home located in Philadelphia County with nearby schools including Southwark School, South Philadelphia High School, and St. Thomas Aquinas Catholic School.
Ownership History
Date
Name
Owned For
Owner Type
Purchase Details
Closed on
Dec 1, 2004
Sold by
Nguyen Vinh and Au Lan Thi
Bought by
Fam Teddy
Current Estimated Value
Home Financials for this Owner
Home Financials are based on the most recent Mortgage that was taken out on this home.
Original Mortgage
$160,250
Outstanding Balance
$79,986
Interest Rate
5.68%
Mortgage Type
Purchase Money Mortgage
Estimated Equity
$250,821
Purchase Details
Closed on
Feb 26, 1999
Sold by
Locicero Alfred and Locicero Pauline
Bought by
Nguyen Vinh and Au Lan Thi T
Create a Home Valuation Report for This Property
The Home Valuation Report is an in-depth analysis detailing your home's value as well as a comparison with similar homes in the area
Home Values in the Area
Average Home Value in this Area
Purchase History
| Date | Buyer | Sale Price | Title Company |
|---|---|---|---|
| Fam Teddy | $165,240 | -- | |
| Nguyen Vinh | $50,000 | -- |
Source: Public Records
Mortgage History
| Date | Status | Borrower | Loan Amount |
|---|---|---|---|
| Open | Fam Teddy | $160,250 |
Source: Public Records
Tax History Compared to Growth
Tax History
| Year | Tax Paid | Tax Assessment Tax Assessment Total Assessment is a certain percentage of the fair market value that is determined by local assessors to be the total taxable value of land and additions on the property. | Land | Improvement |
|---|---|---|---|---|
| 2025 | $3,676 | $286,400 | $57,280 | $229,120 |
| 2024 | $3,676 | $286,400 | $57,280 | $229,120 |
| 2023 | $3,676 | $262,600 | $52,520 | $210,080 |
| 2022 | $2,200 | $217,600 | $52,520 | $165,080 |
| 2021 | $2,830 | $0 | $0 | $0 |
| 2020 | $2,830 | $0 | $0 | $0 |
| 2019 | $2,612 | $0 | $0 | $0 |
| 2018 | $2,198 | $0 | $0 | $0 |
| 2017 | $2,198 | $0 | $0 | $0 |
| 2016 | $1,778 | $0 | $0 | $0 |
| 2015 | $1,826 | $0 | $0 | $0 |
| 2014 | -- | $166,300 | $14,560 | $151,740 |
| 2012 | -- | $11,072 | $2,590 | $8,482 |
Source: Public Records
Map
Nearby Homes