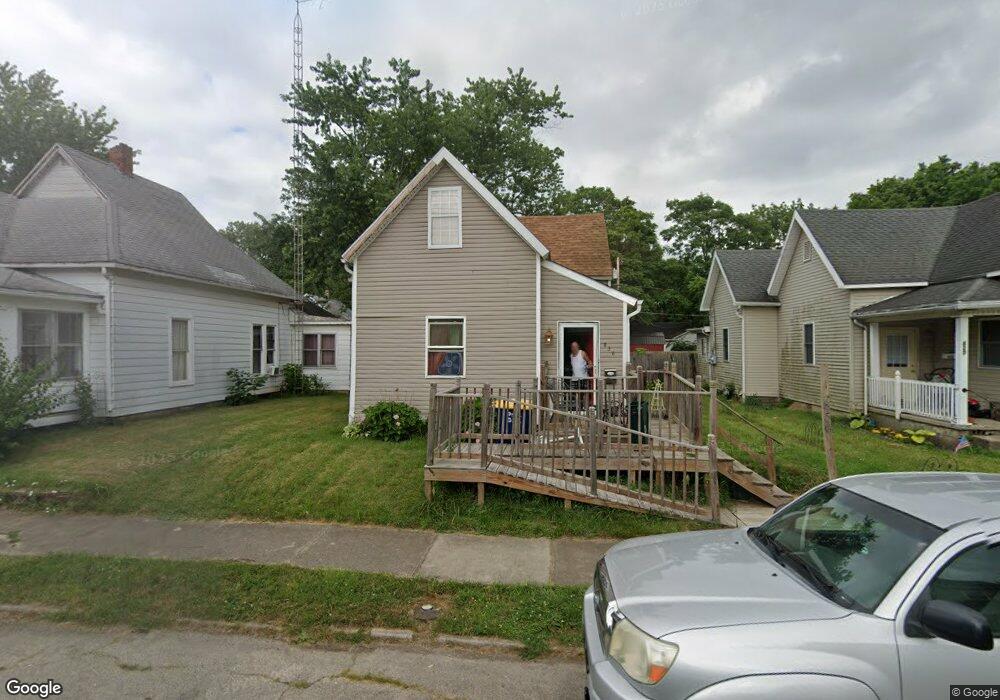
836 N Mulberry St Muncie, IN 47305
McKinley NeighborhoodEstimated Value: $72,000 - $97,000
2
Beds
1
Bath
2,064
Sq Ft
$42/Sq Ft
Est. Value
About This Home
This home is located at 836 N Mulberry St, Muncie, IN 47305 and is currently estimated at $85,917, approximately $41 per square foot. 836 N Mulberry St is a home located in Delaware County with nearby schools including Muncie Central High School, East Washington Academy, and Northside Middle School.
Ownership History
Date
Name
Owned For
Owner Type
Purchase Details
Closed on
Jul 23, 2018
Sold by
Gonzales Jose A
Bought by
Gonzales Jose A and Winton Thomas Jason
Current Estimated Value
Purchase Details
Closed on
Sep 22, 2006
Sold by
Siler Don J and Hughes Brian E
Bought by
Gonzalez Jose A
Home Financials for this Owner
Home Financials are based on the most recent Mortgage that was taken out on this home.
Original Mortgage
$41,200
Outstanding Balance
$24,634
Interest Rate
6.59%
Mortgage Type
New Conventional
Estimated Equity
$61,283
Create a Home Valuation Report for This Property
The Home Valuation Report is an in-depth analysis detailing your home's value as well as a comparison with similar homes in the area
Home Values in the Area
Average Home Value in this Area
Purchase History
| Date | Buyer | Sale Price | Title Company |
|---|---|---|---|
| Gonzales Jose A | -- | None Available | |
| Gonzalez Jose A | -- | None Available |
Source: Public Records
Mortgage History
| Date | Status | Borrower | Loan Amount |
|---|---|---|---|
| Open | Gonzalez Jose A | $41,200 |
Source: Public Records
Tax History Compared to Growth
Tax History
| Year | Tax Paid | Tax Assessment Tax Assessment Total Assessment is a certain percentage of the fair market value that is determined by local assessors to be the total taxable value of land and additions on the property. | Land | Improvement |
|---|---|---|---|---|
| 2024 | $355 | $24,700 | $6,900 | $17,800 |
| 2023 | $340 | $23,000 | $6,900 | $16,100 |
| 2022 | $277 | $25,000 | $6,900 | $18,100 |
| 2021 | $199 | $18,300 | $5,000 | $13,300 |
| 2020 | $197 | $18,300 | $5,000 | $13,300 |
| 2019 | $194 | $18,300 | $5,000 | $13,300 |
| 2018 | $189 | $18,300 | $5,000 | $13,300 |
| 2017 | $188 | $18,300 | $5,000 | $13,300 |
| 2016 | $191 | $18,300 | $5,000 | $13,300 |
| 2014 | $123 | $18,500 | $5,000 | $13,500 |
| 2013 | -- | $18,400 | $5,000 | $13,400 |
Source: Public Records
Map
Nearby Homes
- 202 E Maple St
- 802 1/2 N Mulberry St
- 723 N Jefferson St
- 404 E Mcculloch Blvd
- 210 E Ward Ave
- 709 N Wheeling Ave
- 1630 N Granville Ave
- 601 W Riverside Ave
- 320 N Vine St
- 709 W Riverside Ave
- 800 W Lindweth Place
- 216 N Vine St
- 304 N Hackley St
- 114 S Walnut St
- 114 S Walnut St Unit 100 & 200
- 904 N Penn St
- 1804 N Milton St
- 1214 N Penn St
- 1520 N Wheeling Ave
- 1311 E Butler St
- 840 N Mulberry St
- 820 N Mulberry St
- 818 N Mulberry St
- 842 N Mulberry St
- 211 E Maple St
- 816 N Mulberry St
- 217 E Maple St
- 835 N Jefferson St
- 831 N Jefferson St
- 829 N Jefferson St
- 814 N Mulberry St
- 819 N Mulberry St
- 837 N Jefferson St
- 821 N Mulberry St
- 817 N Mulberry St
- 839 N Jefferson St
- 823 N Mulberry St
- 815 N Mulberry St
- 812 N Mulberry St
- 813 N Mulberry St