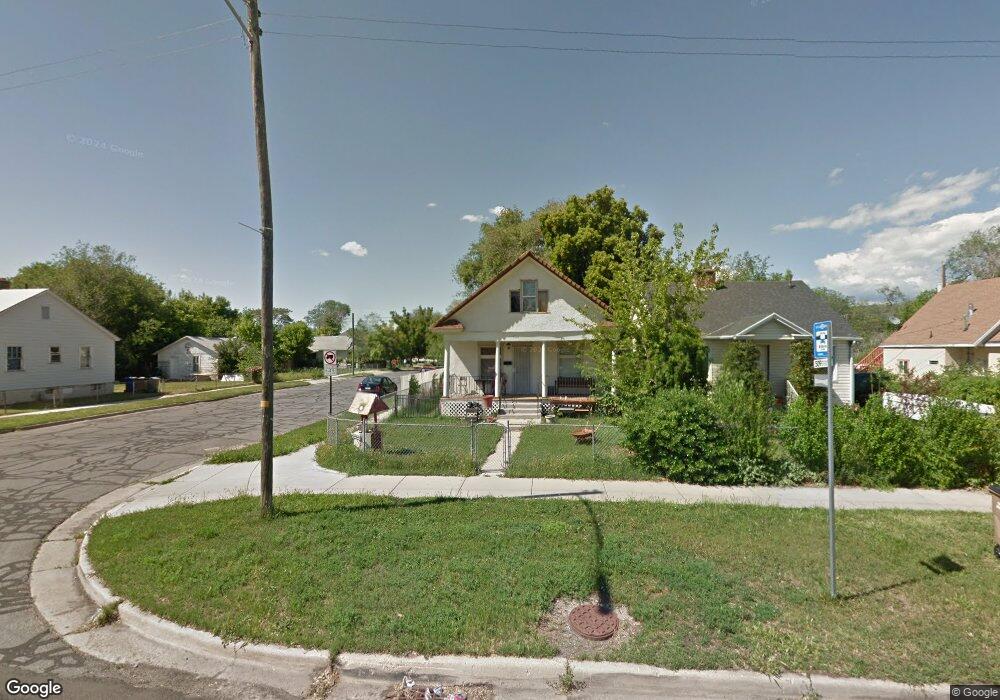
836 W 800 S Salt Lake City, UT 84104
Poplar Grove NeighborhoodEstimated Value: $339,468 - $417,000
2
Beds
1
Bath
1,114
Sq Ft
$328/Sq Ft
Est. Value
About This Home
This home is located at 836 W 800 S, Salt Lake City, UT 84104 and is currently estimated at $365,617, approximately $328 per square foot. 836 W 800 S is a home located in Salt Lake County with nearby schools including Riley Elementary School, Glendale Middle, and Highland High School.
Ownership History
Date
Name
Owned For
Owner Type
Purchase Details
Closed on
Feb 10, 2023
Sold by
Violette Family Living Trust
Bought by
Violette Clarence W and Violette Charles H
Current Estimated Value
Purchase Details
Closed on
May 6, 2004
Sold by
Violette Peter R and Violette Alana C
Bought by
Violette Clarence W and Violette Alana Celine
Purchase Details
Closed on
Jul 3, 1997
Sold by
Ishoy Glen A and Ishoy Betty
Bought by
Violette Peter R
Purchase Details
Closed on
Jun 24, 1997
Sold by
Meridian Title Company
Bought by
Ishoy Glen A and Ishoy Betty
Purchase Details
Closed on
Jan 24, 1997
Sold by
Benson Karl R and Benson Juliane F
Bought by
Ishoy Glen A and Ishoy Betty
Create a Home Valuation Report for This Property
The Home Valuation Report is an in-depth analysis detailing your home's value as well as a comparison with similar homes in the area
Home Values in the Area
Average Home Value in this Area
Purchase History
| Date | Buyer | Sale Price | Title Company |
|---|---|---|---|
| Violette Clarence W | -- | Titlefact Inc | |
| Violette Clarence W | -- | -- | |
| Violette Peter R | -- | -- | |
| Ishoy Glen A | -- | -- | |
| Ishoy Glen A | -- | -- |
Source: Public Records
Tax History Compared to Growth
Tax History
| Year | Tax Paid | Tax Assessment Tax Assessment Total Assessment is a certain percentage of the fair market value that is determined by local assessors to be the total taxable value of land and additions on the property. | Land | Improvement |
|---|---|---|---|---|
| 2025 | $1,241 | $257,300 | $77,300 | $180,000 |
| 2024 | $1,241 | $236,700 | $73,200 | $163,500 |
| 2023 | $1,142 | $210,000 | $70,300 | $139,700 |
| 2022 | $1,254 | $216,300 | $69,000 | $147,300 |
| 2021 | $1,054 | $164,700 | $52,200 | $112,500 |
| 2020 | $1,010 | $150,200 | $46,600 | $103,600 |
| 2019 | $1,026 | $143,500 | $46,600 | $96,900 |
| 2018 | $0 | $96,000 | $47,400 | $48,600 |
| 2017 | $748 | $95,500 | $47,400 | $48,100 |
| 2016 | $735 | $89,100 | $39,900 | $49,200 |
| 2015 | $770 | $88,500 | $40,400 | $48,100 |
| 2014 | $715 | $81,500 | $38,600 | $42,900 |
Source: Public Records
Map
Nearby Homes