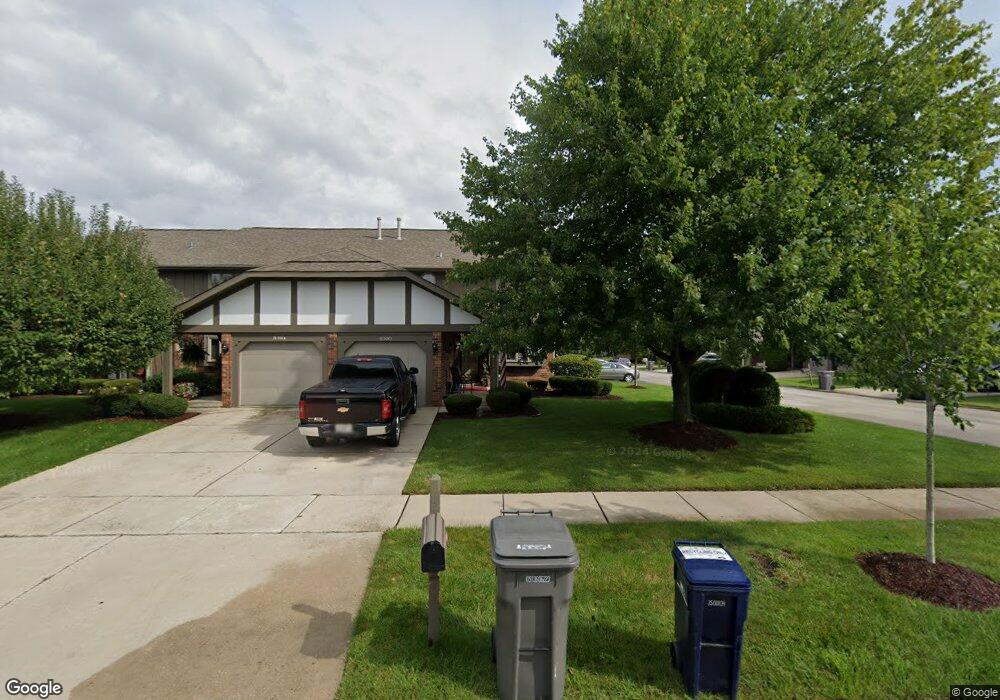
8360 W 140th St Orland Park, IL 60462
Silver Lake North NeighborhoodEstimated Value: $310,000 - $335,000
3
Beds
3
Baths
1,754
Sq Ft
$183/Sq Ft
Est. Value
About This Home
This home is located at 8360 W 140th St, Orland Park, IL 60462 and is currently estimated at $321,076, approximately $183 per square foot. 8360 W 140th St is a home located in Cook County with nearby schools including Prairie Elementary School, Liberty Elementary School, and Jerling Junior High School.
Ownership History
Date
Name
Owned For
Owner Type
Purchase Details
Closed on
Dec 28, 2018
Sold by
Bingenheimer Anthony
Bought by
Murphy Erin
Current Estimated Value
Home Financials for this Owner
Home Financials are based on the most recent Mortgage that was taken out on this home.
Original Mortgage
$164,600
Outstanding Balance
$103,394
Interest Rate
4%
Mortgage Type
New Conventional
Estimated Equity
$217,682
Purchase Details
Closed on
Sep 20, 2010
Sold by
Marquette Bank
Bought by
Bingenheimer Anthony M and Murphy Erin K
Home Financials for this Owner
Home Financials are based on the most recent Mortgage that was taken out on this home.
Original Mortgage
$192,408
Interest Rate
4.25%
Mortgage Type
FHA
Purchase Details
Closed on
Oct 1, 2008
Sold by
Witry Louis A and Witry David A
Bought by
Marquette Bank and Trust #18752
Purchase Details
Closed on
Jun 9, 1995
Sold by
Witry Louis A
Bought by
Witry Louis A and Witry David A
Create a Home Valuation Report for This Property
The Home Valuation Report is an in-depth analysis detailing your home's value as well as a comparison with similar homes in the area
Home Values in the Area
Average Home Value in this Area
Purchase History
| Date | Buyer | Sale Price | Title Company |
|---|---|---|---|
| Murphy Erin | -- | Chicago Title | |
| Bingenheimer Anthony M | $195,000 | Fidelity Natl Title Ins Co | |
| Marquette Bank | -- | None Available | |
| Witry Louis A | -- | -- |
Source: Public Records
Mortgage History
| Date | Status | Borrower | Loan Amount |
|---|---|---|---|
| Open | Murphy Erin | $164,600 | |
| Previous Owner | Bingenheimer Anthony M | $192,408 |
Source: Public Records
Tax History Compared to Growth
Tax History
| Year | Tax Paid | Tax Assessment Tax Assessment Total Assessment is a certain percentage of the fair market value that is determined by local assessors to be the total taxable value of land and additions on the property. | Land | Improvement |
|---|---|---|---|---|
| 2024 | $5,927 | $27,000 | $1,380 | $25,620 |
| 2023 | $4,416 | $27,000 | $1,380 | $25,620 |
| 2022 | $4,416 | $18,162 | $1,196 | $16,966 |
| 2021 | $4,291 | $18,161 | $1,196 | $16,965 |
| 2020 | $4,193 | $18,161 | $1,196 | $16,965 |
| 2019 | $4,614 | $20,240 | $1,104 | $19,136 |
| 2018 | $4,486 | $20,240 | $1,104 | $19,136 |
| 2017 | $4,400 | $20,240 | $1,104 | $19,136 |
| 2016 | $4,340 | $18,052 | $1,012 | $17,040 |
| 2015 | $4,264 | $18,052 | $1,012 | $17,040 |
| 2014 | $4,915 | $18,052 | $1,012 | $17,040 |
| 2013 | $5,019 | $19,583 | $1,012 | $18,571 |
Source: Public Records
Map
Nearby Homes
- 14034 S 84th Ave
- 14023 Chelsea Dr
- 14040 Boxwood Ln
- 13623 S 84th Ave
- 14015 Bonbury Ln
- 8115 Pluskota Dr
- 8134 Uxbridge Dr
- 8820 W 140th St Unit 2A
- 8700 Berkley Ct
- 14111 Tod William Dr
- 13550 86th Ave
- 14345 S 87th Ave
- 14320 S 81st Ct
- 8132 Pickens Dr
- 8932 Pebble Beach Ln
- 13959 Blackhawk Ln
- 8005 Trafalgar Ct
- 14216 Clearview Dr
- 8005 W 143rd Place
- 8810 Clearview Dr Unit 8810
- 8364 W 140th St
- 8368 W 140th St
- 8372 W 140th St
- 13964 Berkhansted Ct
- 13960 Berkhansted Ct
- 13959 S 84th Ave
- 13973 Berkhansted Ct
- 13969 Berkhansted Ct Unit 2
- 13965 Berkhansted Ct
- 13954 Berkhansted Ct
- 13955 S 84th Ave Unit 2
- 13961 Berkhansted Ct
- 14000 Villa Ct
- 13957 Berkhansted Ct
- 13951 S 84th Ave
- 14001 S 84th Ave
- 13953 Berkhansted Ct
- 13950 Berkhansted Ct
- 13947 S 84th Ave
- 13944 Berkhansted Ct