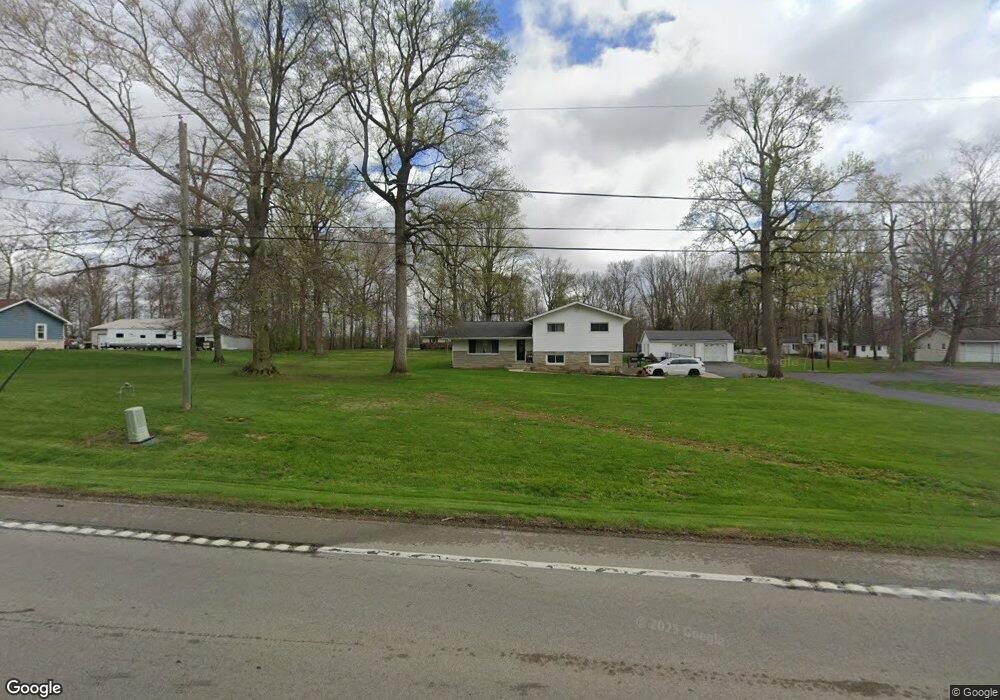
8360 W Delphi Pike Converse, IN 46919
Estimated Value: $184,000 - $270,000
3
Beds
2
Baths
1,920
Sq Ft
$122/Sq Ft
Est. Value
About This Home
This home is located at 8360 W Delphi Pike, Converse, IN 46919 and is currently estimated at $233,514, approximately $121 per square foot. 8360 W Delphi Pike is a home located in Grant County with nearby schools including Converse Elementary School, Sweetser Elementary School, and Oak Hill Junior High School.
Ownership History
Date
Name
Owned For
Owner Type
Purchase Details
Closed on
May 28, 2010
Sold by
Rickner Rod
Bought by
Rickner Jeremy
Current Estimated Value
Purchase Details
Closed on
Feb 5, 2009
Sold by
Lanning Gerald R and Lanning Annette R
Bought by
Rickner Rod and Rickner Jeremy
Purchase Details
Closed on
Nov 10, 2000
Sold by
Not Provided
Bought by
Not Provided
Purchase Details
Closed on
Sep 20, 1999
Sold by
Not Provided
Bought by
Not Provided
Create a Home Valuation Report for This Property
The Home Valuation Report is an in-depth analysis detailing your home's value as well as a comparison with similar homes in the area
Home Values in the Area
Average Home Value in this Area
Purchase History
| Date | Buyer | Sale Price | Title Company |
|---|---|---|---|
| Rickner Jeremy | -- | None Available | |
| Rickner Jeremy | -- | None Available | |
| Rickner Rod | $51,001 | None Available | |
| Not Provided | -- | -- | |
| Not Provided | $112,000 | -- |
Source: Public Records
Tax History Compared to Growth
Tax History
| Year | Tax Paid | Tax Assessment Tax Assessment Total Assessment is a certain percentage of the fair market value that is determined by local assessors to be the total taxable value of land and additions on the property. | Land | Improvement |
|---|---|---|---|---|
| 2024 | $943 | $151,200 | $20,900 | $130,300 |
| 2023 | $838 | $140,300 | $20,900 | $119,400 |
| 2022 | $1,074 | $138,400 | $19,600 | $118,800 |
| 2021 | $931 | $126,700 | $19,600 | $107,100 |
| 2020 | $852 | $123,400 | $19,600 | $103,800 |
| 2019 | $867 | $128,500 | $19,600 | $108,900 |
| 2018 | $708 | $120,000 | $17,800 | $102,200 |
| 2017 | $602 | $114,700 | $17,800 | $96,900 |
| 2016 | $539 | $109,600 | $17,800 | $91,800 |
| 2014 | $408 | $96,900 | $17,800 | $79,100 |
| 2013 | $408 | $96,900 | $17,800 | $79,100 |
Source: Public Records
Map
Nearby Homes
- 7405 W Mier 27
- 9420 W North 00 S 27
- 36 Howard St
- 105 W Wabash St
- 106 W Water St
- 5292 W Delphi Pike
- 603 Broadway St
- 110 Greenberry St
- 105 Peterson Dr
- 218 Greenberry St
- 119 Short St
- 0 Pennsylvania Ave
- 203 Eagle Dr
- 1252 S 600 W
- 514 Allen Dr
- 638 Laura Ln
- 516 Nancy Dr
- 207 W Marks St
- 207 W Lincoln St
- 3598 W Delphi Pike
- 8318 W Delphi Pike
- 8364 W Delphi Pike
- 8392 W Delphi Pike
- 8383 W Delphi Pike
- 8320 W Delphi Pike
- 8282 W Delphi Pike
- 8448 W Delphi Pike
- 8431 W Delphi Pike
- 8281 W Delphi Pike Unit 27
- 8252 W Delphi Pike
- 8453 W Delphi Pike
- 8473 W Delphi Pike
- 8493 W Delphi Pike
- 8514 W Delphi Pike
- 8513 W Delphi Pike
- 8533 W Delphi Pike
- 8321 W Mier 27
- 8558 W Delphi Pike
- 8584 W Delphi Pike
- 8472 W Mier 27