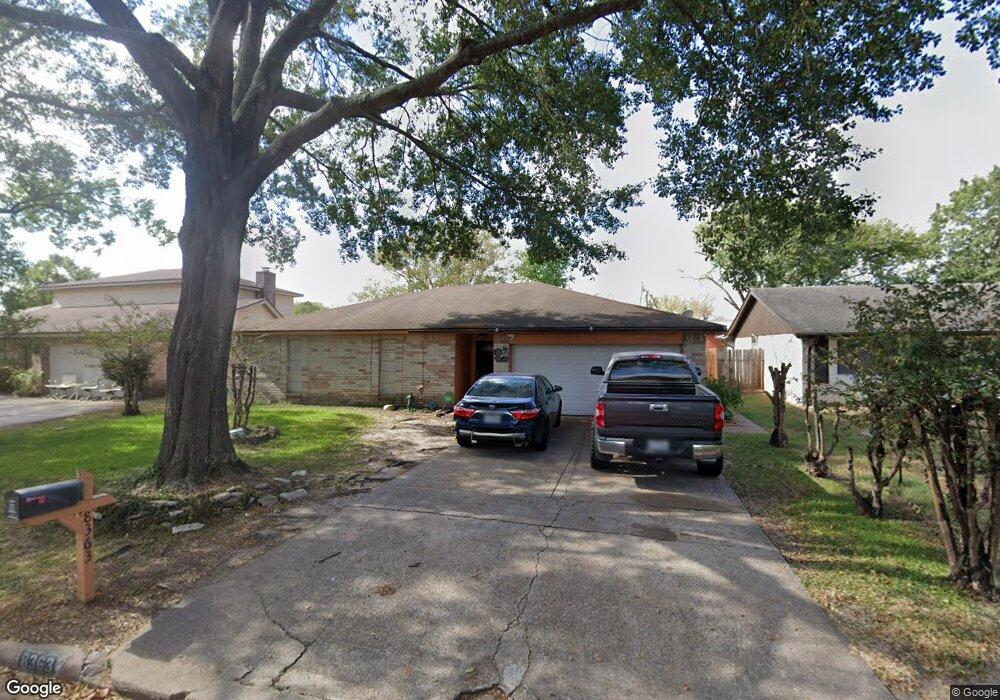
8363 Sorrel Dr Houston, TX 77064
North Houston NeighborhoodEstimated Value: $202,000 - $218,000
3
Beds
2
Baths
1,370
Sq Ft
$154/Sq Ft
Est. Value
About This Home
This home is located at 8363 Sorrel Dr, Houston, TX 77064 and is currently estimated at $211,470, approximately $154 per square foot. 8363 Sorrel Dr is a home located in Harris County with nearby schools including Frazier Elementary School, Cook Middle School, and Jersey Village High School.
Ownership History
Date
Name
Owned For
Owner Type
Purchase Details
Closed on
Jul 22, 2015
Sold by
Wankum Investments Llc
Bought by
Martinez Izbeth Diego
Current Estimated Value
Home Financials for this Owner
Home Financials are based on the most recent Mortgage that was taken out on this home.
Original Mortgage
$108,007
Outstanding Balance
$84,247
Interest Rate
3.87%
Mortgage Type
FHA
Estimated Equity
$127,223
Purchase Details
Closed on
Oct 10, 2013
Sold by
Wankum Gary and Wankum Ann
Bought by
Wankum Invesments Llc
Home Financials for this Owner
Home Financials are based on the most recent Mortgage that was taken out on this home.
Original Mortgage
$98,342
Interest Rate
4.62%
Mortgage Type
Purchase Money Mortgage
Purchase Details
Closed on
Jun 10, 2013
Sold by
Parson James V and Parson Terry L
Bought by
Wankum Gary and Wankum Ann
Purchase Details
Closed on
Oct 26, 2001
Sold by
Clark Keith W and Clark Deborah F
Bought by
Parson James and Parson Terry L
Home Financials for this Owner
Home Financials are based on the most recent Mortgage that was taken out on this home.
Original Mortgage
$79,800
Interest Rate
6.77%
Create a Home Valuation Report for This Property
The Home Valuation Report is an in-depth analysis detailing your home's value as well as a comparison with similar homes in the area
Home Values in the Area
Average Home Value in this Area
Purchase History
| Date | Buyer | Sale Price | Title Company |
|---|---|---|---|
| Martinez Izbeth Diego | -- | Stewart Title | |
| Wankum Invesments Llc | -- | None Available | |
| Wankum Gary | -- | Infinity Title Company | |
| Parson James | -- | Stewart Title Company |
Source: Public Records
Mortgage History
| Date | Status | Borrower | Loan Amount |
|---|---|---|---|
| Open | Martinez Izbeth Diego | $108,007 | |
| Previous Owner | Wankum Invesments Llc | $98,342 | |
| Previous Owner | Parson James | $79,800 |
Source: Public Records
Tax History Compared to Growth
Tax History
| Year | Tax Paid | Tax Assessment Tax Assessment Total Assessment is a certain percentage of the fair market value that is determined by local assessors to be the total taxable value of land and additions on the property. | Land | Improvement |
|---|---|---|---|---|
| 2025 | $1,805 | $194,613 | $50,715 | $143,898 |
| 2024 | $1,805 | $199,337 | $50,715 | $148,622 |
| 2023 | $1,805 | $202,141 | $50,715 | $151,426 |
| 2022 | $3,904 | $170,000 | $36,225 | $133,775 |
| 2021 | $3,740 | $148,507 | $36,225 | $112,282 |
| 2020 | $3,542 | $132,442 | $30,240 | $102,202 |
| 2019 | $3,348 | $121,500 | $20,790 | $100,710 |
| 2018 | $1,117 | $128,183 | $20,790 | $107,393 |
| 2017 | $3,559 | $128,183 | $20,790 | $107,393 |
| 2016 | $3,332 | $120,017 | $17,325 | $102,692 |
| 2015 | $2,476 | $107,147 | $17,325 | $89,822 |
| 2014 | $2,476 | $86,749 | $12,285 | $74,464 |
Source: Public Records
Map
Nearby Homes
- 7615 Fur Market Dr
- 8326 Sorrel Dr
- 8406 Daycoach Ln
- 7535 Roaring Springs Dr
- 7727 Westbank Ave
- 7911 Bova Rd
- 7926 Westington Ln
- 7706 Cloverlake Ct
- 10515 Ince Ln
- 7671 Bubbling Spring Ln
- 5715 & 5721 Spindle Dr
- 5624 Spindle Dr
- 8603 Little River Rd
- 8115 Oahu Ct
- 8202 Terrace Brook Dr
- 7650 Smiling Wood Ln
- 6508 Redcliff Rd
- 7602 Smiling Wood Ln
- 7510 Bubbling Spring Ln
- 7819 Koloa River Ct
- 8367 Sorrel Dr
- 8306 Twin Lamps Ln
- 8355 Sorrel Dr
- 8371 Sorrel Dr
- 8302 Twin Lamps Ln
- 8310 Twin Lamps Ln
- 8362 Sorrel Dr
- 8358 Sorrel Dr
- 8366 Sorrel Dr
- 8351 Sorrel Dr
- 8375 Sorrel Dr
- 8354 Sorrel Dr
- 8370 Sorrel Dr
- 8314 Twin Lamps Ln
- 8350 Sorrel Dr
- 7610 Fur Market Dr
- 8379 Sorrel Dr
- 8303 Twin Lamps Ln
- 7614 Fur Market Dr
- 8374 Sorrel Dr