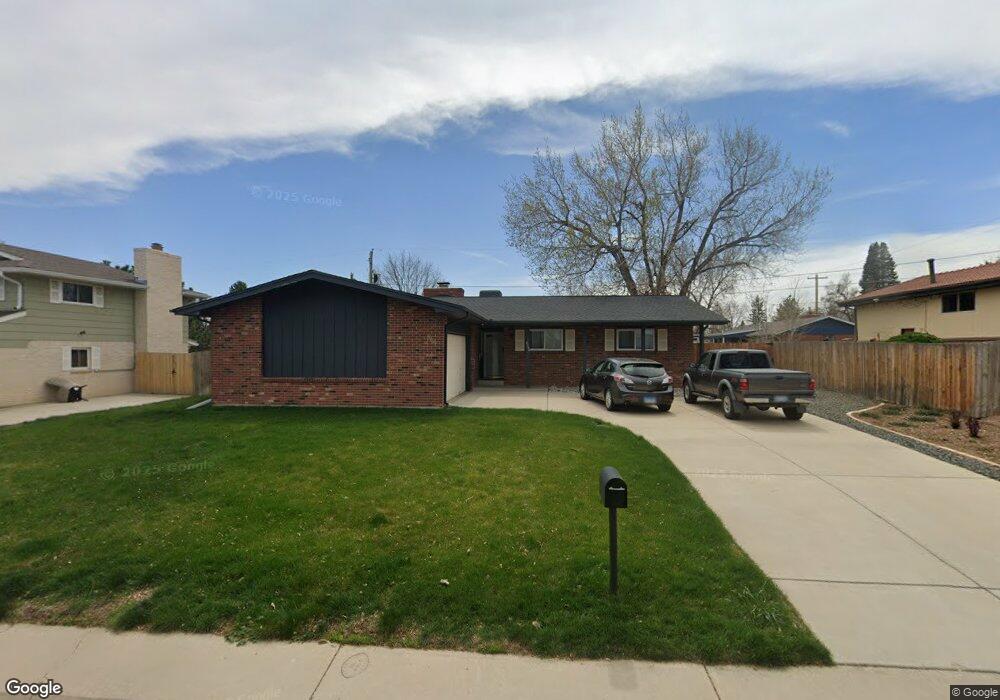
8364 W 71st Ave Arvada, CO 80004
Scenic Heights NeighborhoodEstimated Value: $669,000 - $796,000
3
Beds
2
Baths
1,605
Sq Ft
$445/Sq Ft
Est. Value
About This Home
This home is located at 8364 W 71st Ave, Arvada, CO 80004 and is currently estimated at $714,525, approximately $445 per square foot. 8364 W 71st Ave is a home located in Jefferson County with nearby schools including Secrest Elementary School, North Arvada Middle School, and Arvada High School.
Ownership History
Date
Name
Owned For
Owner Type
Purchase Details
Closed on
Jan 21, 2020
Sold by
Crescent Private Equities Re2013a Llc
Bought by
Watkins Jonathan
Current Estimated Value
Home Financials for this Owner
Home Financials are based on the most recent Mortgage that was taken out on this home.
Original Mortgage
$400,000
Outstanding Balance
$349,784
Interest Rate
3.73%
Mortgage Type
New Conventional
Estimated Equity
$364,741
Purchase Details
Closed on
Jun 22, 2016
Sold by
Steen Helen E
Bought by
Crescent Private Equities Re2013a Llc
Purchase Details
Closed on
Nov 20, 2013
Sold by
Steen Helen E
Bought by
The Phil Steen & Helen E Steen Survivors and Phil Steen & Helen E Steen Decedents Tru
Purchase Details
Closed on
Oct 1, 1996
Sold by
Phil Steen and Steen Helen E
Bought by
Steen Phil and Steen Helen E
Create a Home Valuation Report for This Property
The Home Valuation Report is an in-depth analysis detailing your home's value as well as a comparison with similar homes in the area
Home Values in the Area
Average Home Value in this Area
Purchase History
We collect this data history from publicly available records. To have your information removed, we recommend requesting removal directly through your county’s website.
| Date | Buyer | Sale Price | Title Company |
|---|---|---|---|
| Watkins Jonathan | $500,000 | Heritage Title Company | |
| Crescent Private Equities Re2013a Llc | $350,000 | Land Title Guarantee Company | |
| The Phil Steen & Helen E Steen Survivors | $500 | None Available | |
| Steen Phil | -- | -- |
Source: Public Records
Mortgage History
We collect this data history from publicly available records. To have your information removed, we recommend requesting removal directly through your county’s website.
| Date | Status | Borrower | Loan Amount |
|---|---|---|---|
| Open | Watkins Jonathan | $400,000 |
Source: Public Records
Tax History
| Year | Tax Paid | Tax Assessment Tax Assessment Total Assessment is a certain percentage of the fair market value that is determined by local assessors to be the total taxable value of land and additions on the property. | Land | Improvement |
|---|---|---|---|---|
| 2025 | $4,599 | $44,595 | $14,332 | $30,263 |
| 2024 | $4,479 | $46,179 | $17,812 | $28,367 |
| 2023 | $4,479 | $46,179 | $17,812 | $28,367 |
| 2022 | $3,653 | $37,297 | $13,935 | $23,362 |
| 2021 | $3,713 | $38,370 | $14,336 | $24,034 |
| 2020 | $2,564 | $26,571 | $10,547 | $16,024 |
| 2019 | $2,530 | $26,571 | $10,547 | $16,024 |
| 2018 | $2,595 | $26,504 | $8,825 | $17,679 |
| 2017 | $2,376 | $26,504 | $8,825 | $17,679 |
| 2016 | $1,388 | $22,545 | $6,092 | $16,453 |
| 2015 | $702 | $22,545 | $6,092 | $16,453 |
| 2014 | $1,169 | $19,502 | $5,158 | $14,344 |
Source: Public Records
Map
Nearby Homes
- 8300 W 72nd Place
- 6958 Brentwood Ct
- 7555 W 69th Place
- 8320 W 66th Ave
- 6795 Garrison St
- 6500 Brentwood St
- 6832 Garland St
- 7461 Webster St
- 6575 Estes St
- 7194 W 68th Ave
- 7232 W 67th Place
- 6685 Upham St
- 7462 Vance St
- 6969 Hoyt Ct
- 8928 W 65th Ave
- 7366 W 75th Ave
- 6453 Zephyr St
- 8885 W 64th Place
- 6942 W 68th Place
- 7402 W 76th Ave
- 8353 W 70th Place
- 8343 W 70th Place
- 8363 W 70th Place
- 8344 W 71st Ave
- 8324 W 71st Ave
- 70th W 70th Ave
- 8352 W 70th Place
- 8333 W 70th Place
- 7054 Carr St
- 8342 W 70th Place
- 8362 W 70th Place
- 8304 W 71st Ave
- 7074 Carr St
- 8332 W 70th Place
- 7034 Carr St
- 8323 W 70th Place
- 8294 W 71st Ave
- 8351 W 70th Ave
- 8345 W 71st Ave
- 8325 W 71st Ave
Your Personal Tour Guide
Ask me questions while you tour the home.