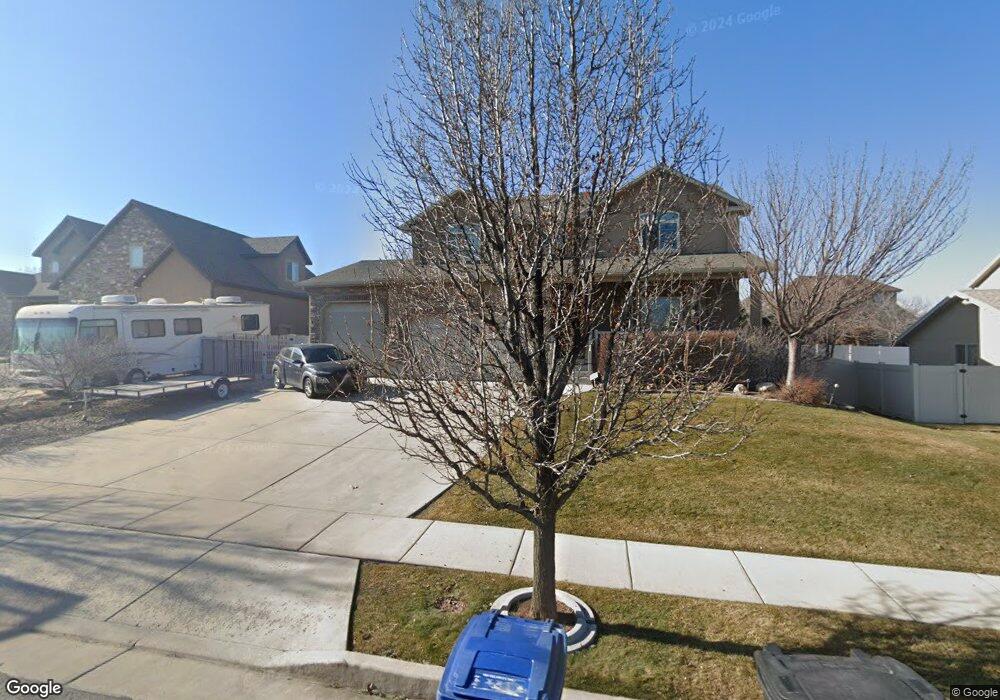
8368 Birch Fork Dr West Jordan, UT 84081
Jordan Hills NeighborhoodEstimated Value: $646,000 - $821,000
4
Beds
3
Baths
3,997
Sq Ft
$183/Sq Ft
Est. Value
About This Home
This home is located at 8368 Birch Fork Dr, West Jordan, UT 84081 and is currently estimated at $733,265, approximately $183 per square foot. 8368 Birch Fork Dr is a home located in Salt Lake County with nearby schools including Fox Hollow School, Sunset Ridge Middle School, and Copper Hills High School.
Ownership History
Date
Name
Owned For
Owner Type
Purchase Details
Closed on
Apr 29, 2008
Sold by
Kehl Homes Inc
Bought by
Gee Christopher A and Gee Tamarin R
Current Estimated Value
Home Financials for this Owner
Home Financials are based on the most recent Mortgage that was taken out on this home.
Original Mortgage
$400,711
Outstanding Balance
$252,838
Interest Rate
5.81%
Mortgage Type
FHA
Estimated Equity
$480,427
Purchase Details
Closed on
Aug 8, 2006
Sold by
Jsb Corp
Bought by
Marsh Darin L
Home Financials for this Owner
Home Financials are based on the most recent Mortgage that was taken out on this home.
Original Mortgage
$231,840
Interest Rate
6.76%
Mortgage Type
Purchase Money Mortgage
Purchase Details
Closed on
Jul 3, 2006
Sold by
Peterson Barrett and Peterson Ashley
Bought by
Jsb Corp
Home Financials for this Owner
Home Financials are based on the most recent Mortgage that was taken out on this home.
Original Mortgage
$231,840
Interest Rate
6.76%
Mortgage Type
Purchase Money Mortgage
Create a Home Valuation Report for This Property
The Home Valuation Report is an in-depth analysis detailing your home's value as well as a comparison with similar homes in the area
Home Values in the Area
Average Home Value in this Area
Purchase History
| Date | Buyer | Sale Price | Title Company |
|---|---|---|---|
| Gee Christopher A | -- | Merrill Title | |
| Marsh Darin L | -- | Integrated Title Ins Service | |
| Jsb Corp | -- | Integrated Title Ins Service |
Source: Public Records
Mortgage History
| Date | Status | Borrower | Loan Amount |
|---|---|---|---|
| Open | Gee Christopher A | $400,711 | |
| Previous Owner | Marsh Darin L | $231,840 |
Source: Public Records
Tax History Compared to Growth
Tax History
| Year | Tax Paid | Tax Assessment Tax Assessment Total Assessment is a certain percentage of the fair market value that is determined by local assessors to be the total taxable value of land and additions on the property. | Land | Improvement |
|---|---|---|---|---|
| 2025 | $3,403 | $672,400 | $174,800 | $497,600 |
| 2024 | $3,403 | $654,800 | $169,700 | $485,100 |
| 2023 | $3,452 | $625,900 | $163,200 | $462,700 |
| 2022 | $3,577 | $638,200 | $160,000 | $478,200 |
| 2021 | $2,988 | $485,300 | $126,000 | $359,300 |
| 2020 | $2,816 | $429,200 | $126,000 | $303,200 |
| 2019 | $2,845 | $425,200 | $126,000 | $299,200 |
| 2018 | $2,698 | $399,900 | $124,000 | $275,900 |
| 2017 | $2,544 | $375,400 | $124,000 | $251,400 |
| 2016 | $2,522 | $349,700 | $121,000 | $228,700 |
| 2015 | $2,457 | $332,200 | $123,300 | $208,900 |
| 2014 | $2,231 | $297,000 | $111,700 | $185,300 |
Source: Public Records
Map
Nearby Homes
- 5958 W Eric Mountain Ln
- 5958 W Eric Mountain Ln Unit 104
- 5946 W Eric Mountain Ln Unit 103
- 8501 S Michele River Ave Unit 116
- Larsen Plan at Copperhaven by Toll Brothers
- Brooke Plan at Copperhaven by Toll Brothers
- 8368 S Oak Gate Dr
- 5958 W 8100 S
- 6006 W Highlandbrook Dr
- 8356 S Four Elm Cir
- 8457 S 6430 W
- 8497 S 6465 W
- 6374 W 8680 S
- 6058 W Sapphire St Unit 340
- 6052 W Sapphire St Unit 341
- 6064 W Sapphire St Unit 339
- 6066 W Sapphire St Unit 338
- 6066 W Sapphire St
- 6046 W Sapphire St Unit 342
- 6042 W Sapphire St Unit 343
- 8344 Birch Fork Dr
- 8332 Birch Fork Dr
- 6044 W Sage Fork Rd
- 6044 Sage Fork Rd
- 8394 S Birch Fork Dr
- 8394 S Birch Fork Dr
- 8337 S Birch Fork Dr
- 8357 Water Oak Dr
- 8357 S Water Oak Dr
- 8341 Water Oak Dr
- 8369 Water Oak Dr
- 8329 Water Oak Dr
- 8329 S Water Oak Dr
- 6026 W Sage Fork Rd
- 6026 W Sage Fork Rd Unit 134
- 6057 W Sage Fork Rd
- 6057 W Sage Fork Rd Unit 122
- 6031 W Juniper Fork Dr
- 6031 W Juniper Fork Dr
- 8316 S Birch Fork Dr