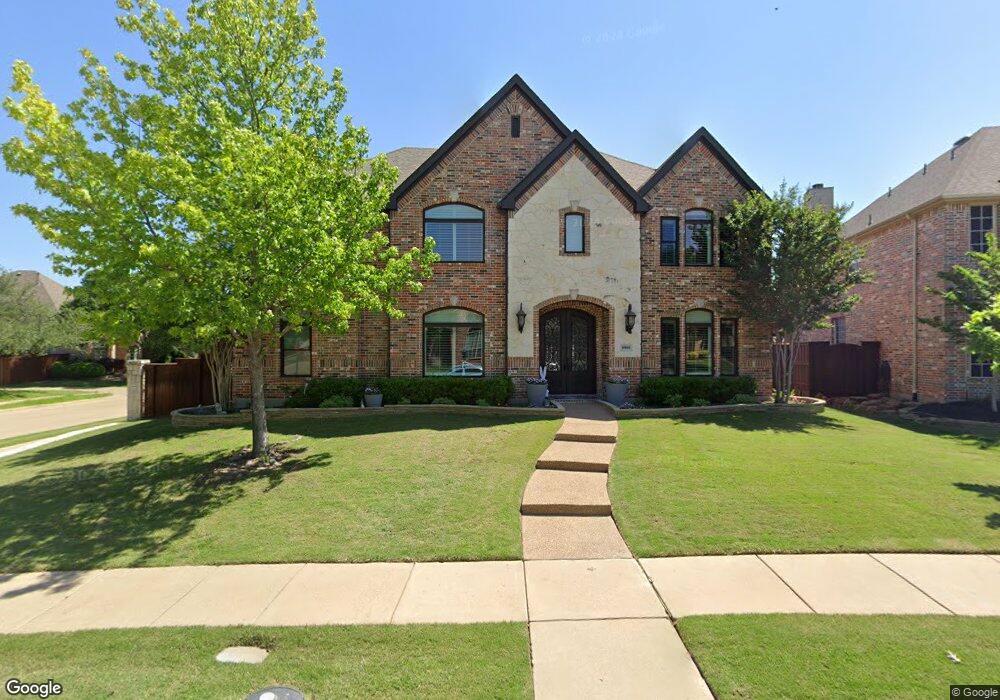
8368 Mckenzie Ct Frisco, TX 75034
Southwest Frisco NeighborhoodEstimated Value: $768,000 - $838,000
4
Beds
4
Baths
4,317
Sq Ft
$188/Sq Ft
Est. Value
About This Home
This home is located at 8368 Mckenzie Ct, Frisco, TX 75034 and is currently estimated at $811,405, approximately $187 per square foot. 8368 Mckenzie Ct is a home located in Denton County with nearby schools including Sparks Elementary School, Pioneer Heritage Middle School, and Reedy High School.
Ownership History
Date
Name
Owned For
Owner Type
Purchase Details
Closed on
Jun 6, 2016
Sold by
Cartus Financial Corporation
Bought by
Handren Matthew T
Current Estimated Value
Home Financials for this Owner
Home Financials are based on the most recent Mortgage that was taken out on this home.
Original Mortgage
$373,920
Outstanding Balance
$298,276
Interest Rate
3.64%
Mortgage Type
New Conventional
Estimated Equity
$513,129
Purchase Details
Closed on
May 13, 2016
Sold by
Pope Alice and Pope Edwin
Bought by
Cartur Financial Corporation
Home Financials for this Owner
Home Financials are based on the most recent Mortgage that was taken out on this home.
Original Mortgage
$373,920
Outstanding Balance
$298,276
Interest Rate
3.64%
Mortgage Type
New Conventional
Estimated Equity
$513,129
Purchase Details
Closed on
Oct 22, 2004
Sold by
Drees Custom Homes Lp
Bought by
Sesay Alice
Home Financials for this Owner
Home Financials are based on the most recent Mortgage that was taken out on this home.
Original Mortgage
$287,100
Interest Rate
4.87%
Mortgage Type
Purchase Money Mortgage
Create a Home Valuation Report for This Property
The Home Valuation Report is an in-depth analysis detailing your home's value as well as a comparison with similar homes in the area
Home Values in the Area
Average Home Value in this Area
Purchase History
| Date | Buyer | Sale Price | Title Company |
|---|---|---|---|
| Handren Matthew T | -- | Allegiance Title Co | |
| Cartur Financial Corporation | -- | Allegiance Title Co | |
| Sesay Alice | -- | -- |
Source: Public Records
Mortgage History
| Date | Status | Borrower | Loan Amount |
|---|---|---|---|
| Open | Handren Matthew T | $373,920 | |
| Previous Owner | Cartur Financial Corporation | $373,920 | |
| Previous Owner | Sesay Alice | $287,100 | |
| Closed | Sesay Alice | $71,800 |
Source: Public Records
Tax History Compared to Growth
Tax History
| Year | Tax Paid | Tax Assessment Tax Assessment Total Assessment is a certain percentage of the fair market value that is determined by local assessors to be the total taxable value of land and additions on the property. | Land | Improvement |
|---|---|---|---|---|
| 2025 | $9,964 | $760,712 | $166,320 | $623,175 |
| 2024 | $11,551 | $691,556 | $0 | $0 |
| 2023 | $8,777 | $628,687 | $166,320 | $678,462 |
| 2022 | $10,728 | $571,534 | $133,056 | $516,688 |
| 2021 | $10,297 | $519,576 | $91,476 | $428,100 |
| 2020 | $9,561 | $475,612 | $91,476 | $384,136 |
| 2019 | $10,301 | $487,680 | $91,476 | $396,204 |
| 2018 | $10,379 | $484,000 | $91,476 | $392,524 |
| 2017 | $10,570 | $489,724 | $91,476 | $398,248 |
| 2016 | $9,692 | $449,025 | $71,518 | $377,507 |
| 2015 | $8,394 | $422,332 | $71,518 | $350,814 |
| 2013 | -- | $359,731 | $71,518 | $288,213 |
Source: Public Records
Map
Nearby Homes
- 8201 Mckenzie Ct
- 2066 Angel Falls Dr
- 2338 Angel Falls Dr
- 2385 Bannister Dr
- 1717 Angel Falls Dr
- 8327 Robertson Dr
- 2100 Copperfield Ct
- 7872 Crazy Horse Dr
- 1632 Pleasant Valley Ln
- 2498 Spillway Cir
- 2499 Streamside Ct
- 8646 Robertson Dr
- 2274 Gelding Ln
- 1859 Hollow Falls Ct
- 2734 Sparks Dr
- 1860 Hollow Falls Ct
- 7616 Big Buckle Dr
- 8608 Davis Dr
- 2313 Campfire Ln
- 2339 Campfire Ln
- 8344 Mckenzie Ct
- 8369 Alderon Ln
- 8320 Mckenzie Ct
- 2174 Idlewild Dr
- 8345 Alderon Ln
- 2150 Idlewild Dr
- 8367 Mckenzie Ct
- 2202 Idlewild Dr
- 8321 Alderon Ln
- 2120 Idlewild Dr
- 8296 Mckenzie Ct
- 2100 Idlewild Dr
- 2226 Idlewild Dr
- 8319 Mckenzie Ct
- 8297 Alderon Ln
- 8272 Mckenzie Ct
- 2217 Crystal Falls Dr
- 2233 Crystal Falls Dr
- 8295 Mckenzie Ct
- 8346 Alderon Ln