837 11th St Unit A Tell City, IN 47586
Estimated Value: $115,000 - $149,000
1
Bed
1
Bath
850
Sq Ft
$161/Sq Ft
Est. Value
About This Home
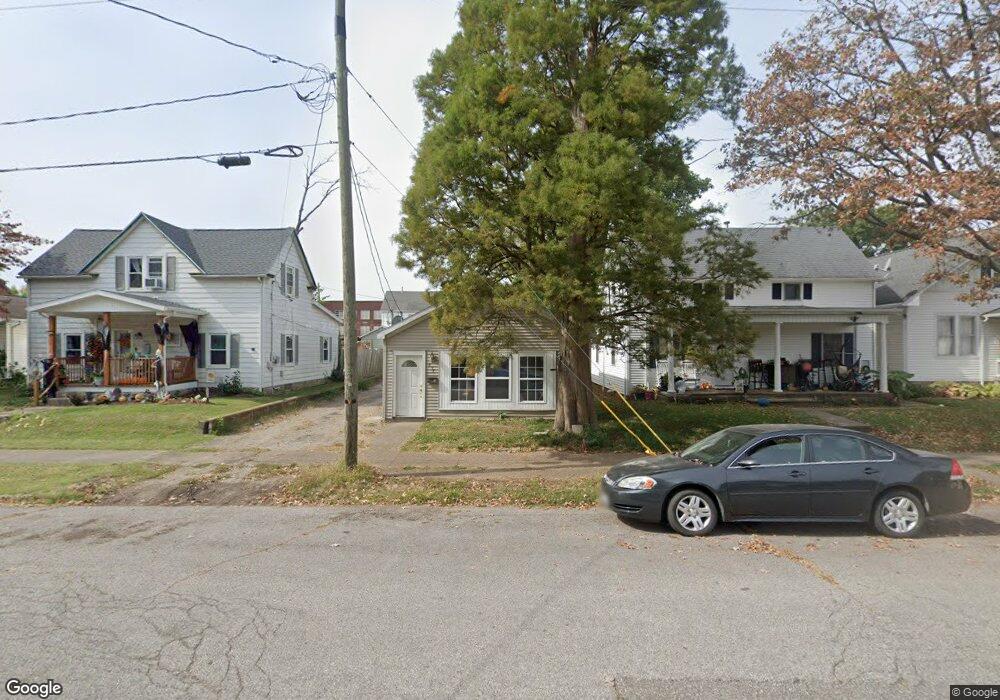
This home is located at 837 11th St Unit A, Tell City, IN 47586 and is currently estimated at $137,139, approximately $161 per square foot. 837 11th St Unit A is a home located in Perry County with nearby schools including William Tell Elementary School, Tell City Junior/Senior High School, and Agape Christian Academy.
Ownership History
Date
Name
Owned For
Owner Type
Purchase Details
Closed on
Jun 25, 2020
Sold by
Pierrard Jeff
Bought by
Ramsey Alexander Wayne
Current Estimated Value
Purchase Details
Closed on
Sep 15, 2006
Sold by
First State Bank
Bought by
Pierrard Jeff
Home Financials for this Owner
Home Financials are based on the most recent Mortgage that was taken out on this home.
Original Mortgage
$30,000
Interest Rate
6.7%
Mortgage Type
Future Advance Clause Open End Mortgage
Create a Home Valuation Report for This Property
The Home Valuation Report is an in-depth analysis detailing your home's value as well as a comparison with similar homes in the area
Home Values in the Area
Average Home Value in this Area
Purchase History
| Date | Buyer | Sale Price | Title Company |
|---|---|---|---|
| Ramsey Alexander Wayne | -- | None Available | |
| Pierrard Jeff | -- | None Available |
Source: Public Records
Mortgage History
| Date | Status | Borrower | Loan Amount |
|---|---|---|---|
| Previous Owner | Pierrard Jeff | $30,000 |
Source: Public Records
Tax History Compared to Growth
Tax History
| Year | Tax Paid | Tax Assessment Tax Assessment Total Assessment is a certain percentage of the fair market value that is determined by local assessors to be the total taxable value of land and additions on the property. | Land | Improvement |
|---|---|---|---|---|
| 2024 | $1,168 | $58,400 | $6,200 | $52,200 |
| 2023 | $1,090 | $54,500 | $6,200 | $48,300 |
| 2022 | $942 | $47,100 | $6,200 | $40,900 |
| 2021 | $916 | $45,800 | $5,200 | $40,600 |
| 2020 | $830 | $41,500 | $5,200 | $36,300 |
| 2019 | $800 | $40,000 | $5,000 | $35,000 |
| 2018 | $794 | $39,700 | $5,000 | $34,700 |
| 2017 | $772 | $38,600 | $5,000 | $33,600 |
| 2016 | $764 | $38,200 | $5,000 | $33,200 |
| 2014 | $772 | $38,600 | $5,200 | $33,400 |
| 2013 | $772 | $38,100 | $5,200 | $32,900 |
Source: Public Records
Map
Nearby Homes