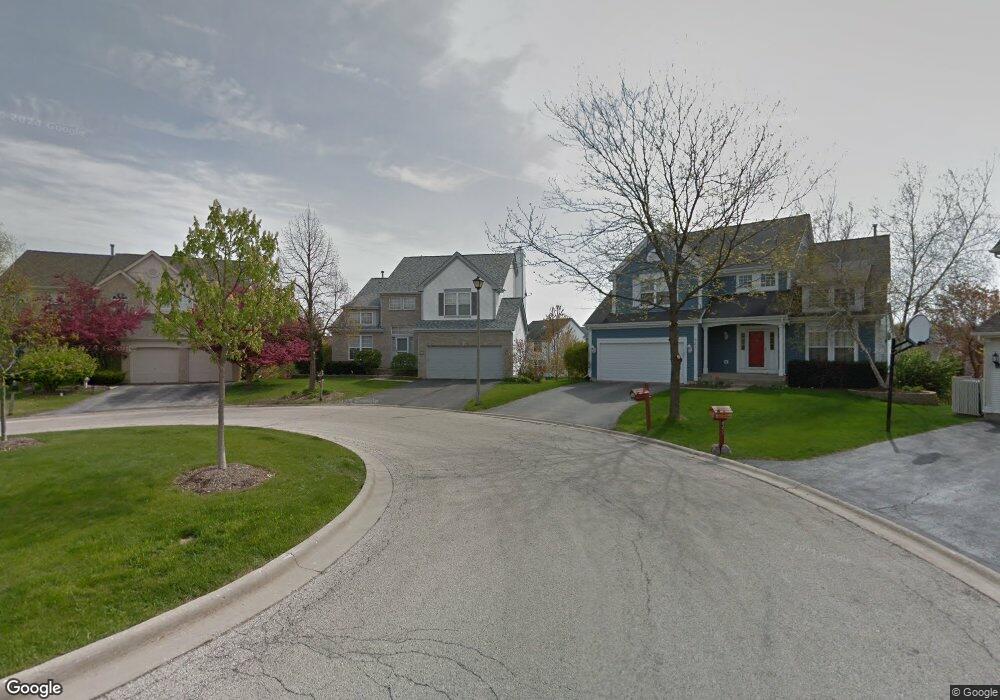
837 Compton Ct Gurnee, IL 60031
Estimated Value: $476,000 - $495,000
5
Beds
4
Baths
2,100
Sq Ft
$229/Sq Ft
Est. Value
About This Home
This home is located at 837 Compton Ct, Gurnee, IL 60031 and is currently estimated at $481,583, approximately $229 per square foot. 837 Compton Ct is a home located in Lake County with nearby schools including Woodland Primary School, Woodland Elementary School, and Woodland Intermediate School.
Ownership History
Date
Name
Owned For
Owner Type
Purchase Details
Closed on
Sep 29, 2008
Sold by
Saul Brett S and Saul Kari M
Bought by
Pocklington Ellis Jonathan D and Pocklington Ellis Shilo
Current Estimated Value
Home Financials for this Owner
Home Financials are based on the most recent Mortgage that was taken out on this home.
Original Mortgage
$244,500
Interest Rate
6.09%
Mortgage Type
Unknown
Purchase Details
Closed on
Jun 16, 1999
Sold by
Langford Michael and Langford Jodi
Bought by
Saul Brett S and Saul Kari M
Home Financials for this Owner
Home Financials are based on the most recent Mortgage that was taken out on this home.
Original Mortgage
$199,200
Interest Rate
7.15%
Purchase Details
Closed on
Jul 28, 1993
Sold by
Northern Tr Bank Lake Forest Natl Assn
Bought by
Langford Michael and Langford Jodi
Home Financials for this Owner
Home Financials are based on the most recent Mortgage that was taken out on this home.
Original Mortgage
$148,000
Interest Rate
7.15%
Create a Home Valuation Report for This Property
The Home Valuation Report is an in-depth analysis detailing your home's value as well as a comparison with similar homes in the area
Home Values in the Area
Average Home Value in this Area
Purchase History
| Date | Buyer | Sale Price | Title Company |
|---|---|---|---|
| Pocklington Ellis Jonathan D | $326,000 | Attorneys Title Guaranty Fun | |
| Saul Brett S | $248,000 | -- | |
| Langford Michael | $148,000 | Chicago Title Insurance Co |
Source: Public Records
Mortgage History
| Date | Status | Borrower | Loan Amount |
|---|---|---|---|
| Previous Owner | Pocklington Ellis Jonathan D | $244,500 | |
| Previous Owner | Saul Brett S | $199,200 | |
| Previous Owner | Langford Michael | $148,000 |
Source: Public Records
Tax History
| Year | Tax Paid | Tax Assessment Tax Assessment Total Assessment is a certain percentage of the fair market value that is determined by local assessors to be the total taxable value of land and additions on the property. | Land | Improvement |
|---|---|---|---|---|
| 2024 | $10,931 | $137,540 | $17,239 | $120,301 |
| 2023 | $10,299 | $119,230 | $14,944 | $104,286 |
| 2022 | $10,299 | $111,658 | $14,948 | $96,710 |
| 2021 | $9,308 | $107,178 | $14,348 | $92,830 |
| 2020 | $9,007 | $104,543 | $13,995 | $90,548 |
| 2019 | $8,750 | $101,508 | $13,589 | $87,919 |
| 2018 | $8,233 | $97,015 | $16,750 | $80,265 |
| 2017 | $8,145 | $94,235 | $16,270 | $77,965 |
| 2016 | $8,078 | $90,040 | $15,546 | $74,494 |
| 2015 | $7,865 | $85,395 | $14,744 | $70,651 |
| 2014 | $6,999 | $79,847 | $14,641 | $65,206 |
| 2012 | $6,887 | $80,458 | $14,753 | $65,705 |
Source: Public Records
Map
Nearby Homes
- 920 Vose Dr Unit 304
- 920 Vose Dr Unit 106
- 755 Darnell Ln
- 758 Chandler Rd Unit U159
- 748 Chandler Rd
- 6167 Golfview Dr
- 33430 N Hunt Club Rd
- 727 Colby Ct Unit U57
- 690 Chandler Rd Unit 302
- 705 Colby Ct Unit U78
- 650 Whitney Ct Unit 211
- 598 Dunham Rd Unit U297
- 6296 Doral Dr
- 6480 Doral Dr
- 1611 Burr Oak Dr
- 649 Wilbur Ct
- 256 Hill n Dale Ct
- 17796 W Greentree Rd
- 6063 Morningside Ct
- 17914 W Twin Lakes Blvd
- 833 Compton Ct
- 841 Compton Ct
- 838 Adderly Ln
- 834 Adderly Ln
- 842 Adderly Ln
- 829 Compton Ct
- 845 Compton Ct
- 830 Adderly Ln
- 846 Adderly Ln
- 821 Dunhill Ct
- 817 Dunhill Ct
- 826 Adderly Ln
- 825 Dunhill Ct
- 850 Adderly Ln
- 822 Adderly Ln
- 835 Bingham Ct
- 813 Dunhill Ct
- 6241 Formoor Ln Unit 4
- 6203 Formoor Ln
- 855 Bingham Ct
Your Personal Tour Guide
Ask me questions while you tour the home.