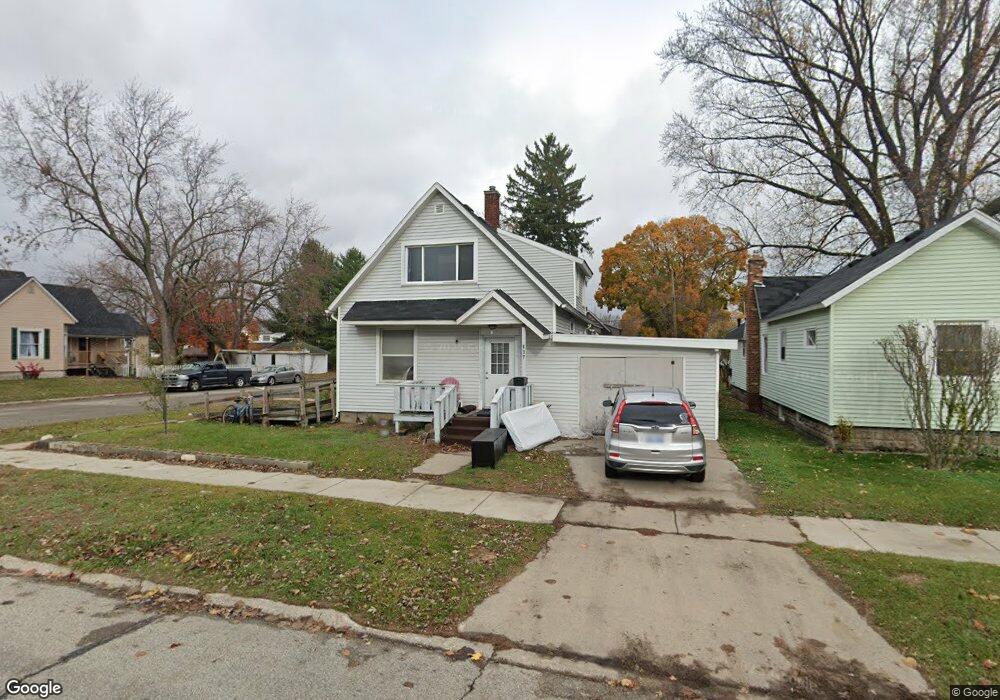
837 Division St Port Huron, MI 48060
Estimated Value: $87,000 - $145,000
4
Beds
2
Baths
1,462
Sq Ft
$81/Sq Ft
Est. Value
About This Home
This home is located at 837 Division St, Port Huron, MI 48060 and is currently estimated at $118,618, approximately $81 per square foot. 837 Division St is a home located in St. Clair County with nearby schools including Woodrow Wilson Elementary School, Central Middle School, and Port Huron High School.
Ownership History
Date
Name
Owned For
Owner Type
Purchase Details
Closed on
May 18, 2023
Sold by
Lepore Giovanni
Bought by
Vertigan Tanya
Current Estimated Value
Purchase Details
Closed on
Jan 19, 2012
Sold by
Lepore Marie H and Brown Stacey
Bought by
Lepore Giovanni Peter
Purchase Details
Closed on
Oct 1, 2008
Sold by
Federal National Mortgage Association
Bought by
Lepore Marie H and Brown Stacey
Purchase Details
Closed on
May 2, 2008
Sold by
Mortgage Electronic Registration Systems
Bought by
Federal National Mortgage Association
Purchase Details
Closed on
May 1, 2008
Sold by
Lunney Norma M
Bought by
Mortgage Electronic Registration Systems
Purchase Details
Closed on
Jan 24, 2006
Sold by
Wright Denise and Kish Ruth
Bought by
Household Finance Corporation Iii
Create a Home Valuation Report for This Property
The Home Valuation Report is an in-depth analysis detailing your home's value as well as a comparison with similar homes in the area
Home Values in the Area
Average Home Value in this Area
Purchase History
| Date | Buyer | Sale Price | Title Company |
|---|---|---|---|
| Vertigan Tanya | -- | None Listed On Document | |
| Lepore Giovanni Peter | -- | None Available | |
| Lepore Marie H | $30,000 | Warranty Title Agency Llc | |
| Federal National Mortgage Association | -- | None Available | |
| Mortgage Electronic Registration Systems | $87,599 | None Available | |
| Household Finance Corporation Iii | -- | None Available |
Source: Public Records
Tax History Compared to Growth
Tax History
| Year | Tax Paid | Tax Assessment Tax Assessment Total Assessment is a certain percentage of the fair market value that is determined by local assessors to be the total taxable value of land and additions on the property. | Land | Improvement |
|---|---|---|---|---|
| 2025 | $2,369 | $52,000 | $0 | $0 |
| 2024 | $2,023 | $49,200 | $0 | $0 |
| 2023 | $1,132 | $56,500 | $0 | $0 |
| 2022 | $1,592 | $46,700 | $0 | $0 |
| 2021 | $1,521 | $38,500 | $0 | $0 |
| 2020 | $1,527 | $33,600 | $33,600 | $0 |
| 2019 | $1,499 | $23,500 | $0 | $0 |
| 2018 | $1,466 | $23,500 | $0 | $0 |
| 2017 | $1,346 | $22,200 | $0 | $0 |
| 2016 | $1,194 | $22,200 | $0 | $0 |
| 2015 | $1,249 | $22,100 | $22,100 | $0 |
| 2014 | $1,249 | $23,200 | $23,200 | $0 |
| 2013 | -- | $25,500 | $0 | $0 |
Source: Public Records
Map
Nearby Homes