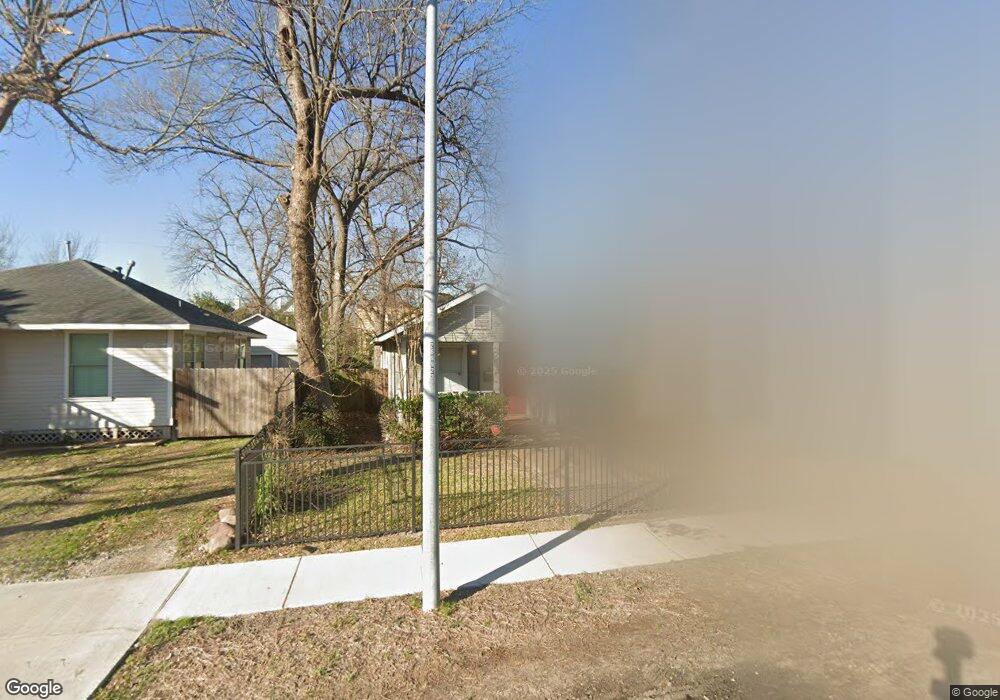
837 E 25th St Houston, TX 77009
Greater Heights NeighborhoodEstimated Value: $474,000 - $805,000
3
Beds
1
Bath
1,102
Sq Ft
$535/Sq Ft
Est. Value
About This Home
This home is located at 837 E 25th St, Houston, TX 77009 and is currently estimated at $589,076, approximately $534 per square foot. 837 E 25th St is a home located in Harris County with nearby schools including Field Elementary School, Hamilton Middle, and Heights High School.
Ownership History
Date
Name
Owned For
Owner Type
Purchase Details
Closed on
Sep 20, 1999
Sold by
Gerardy Richard
Bought by
Homer Michelle
Current Estimated Value
Home Financials for this Owner
Home Financials are based on the most recent Mortgage that was taken out on this home.
Original Mortgage
$101,000
Outstanding Balance
$30,127
Interest Rate
7.9%
Estimated Equity
$558,949
Purchase Details
Closed on
Jan 27, 1999
Sold by
Jones Emma L
Bought by
Jones Curley R
Home Financials for this Owner
Home Financials are based on the most recent Mortgage that was taken out on this home.
Original Mortgage
$86,275
Interest Rate
6.68%
Purchase Details
Closed on
Jan 26, 1999
Sold by
Wood Barry Payne and Wood Betty Blount
Bought by
Whitaker Interests Ltd
Home Financials for this Owner
Home Financials are based on the most recent Mortgage that was taken out on this home.
Original Mortgage
$86,275
Interest Rate
6.68%
Create a Home Valuation Report for This Property
The Home Valuation Report is an in-depth analysis detailing your home's value as well as a comparison with similar homes in the area
Home Values in the Area
Average Home Value in this Area
Purchase History
| Date | Buyer | Sale Price | Title Company |
|---|---|---|---|
| Homer Michelle | -- | Texas American Title Company | |
| Jones Curley R | -- | -- | |
| Whitaker Interests Ltd | -- | Alamo Title 21 |
Source: Public Records
Mortgage History
| Date | Status | Borrower | Loan Amount |
|---|---|---|---|
| Open | Homer Michelle | $101,000 | |
| Previous Owner | Whitaker Interests Ltd | $86,275 |
Source: Public Records
Tax History Compared to Growth
Tax History
| Year | Tax Paid | Tax Assessment Tax Assessment Total Assessment is a certain percentage of the fair market value that is determined by local assessors to be the total taxable value of land and additions on the property. | Land | Improvement |
|---|---|---|---|---|
| 2025 | $7,900 | $566,459 | $450,000 | $116,459 |
| 2024 | $7,900 | $531,614 | $420,000 | $111,614 |
| 2023 | $7,900 | $542,504 | $420,000 | $122,504 |
| 2022 | $9,516 | $465,973 | $360,000 | $105,973 |
| 2021 | $9,157 | $406,392 | $288,000 | $118,392 |
| 2020 | $8,650 | $379,657 | $288,000 | $91,657 |
| 2019 | $8,217 | $371,187 | $288,000 | $83,187 |
| 2018 | $5,704 | $349,875 | $270,000 | $79,875 |
| 2017 | $6,786 | $349,875 | $270,000 | $79,875 |
| 2016 | $6,169 | $339,918 | $240,000 | $99,918 |
| 2015 | $3,988 | $339,918 | $240,000 | $99,918 |
| 2014 | $3,988 | $258,417 | $180,000 | $78,417 |
Source: Public Records
Map
Nearby Homes