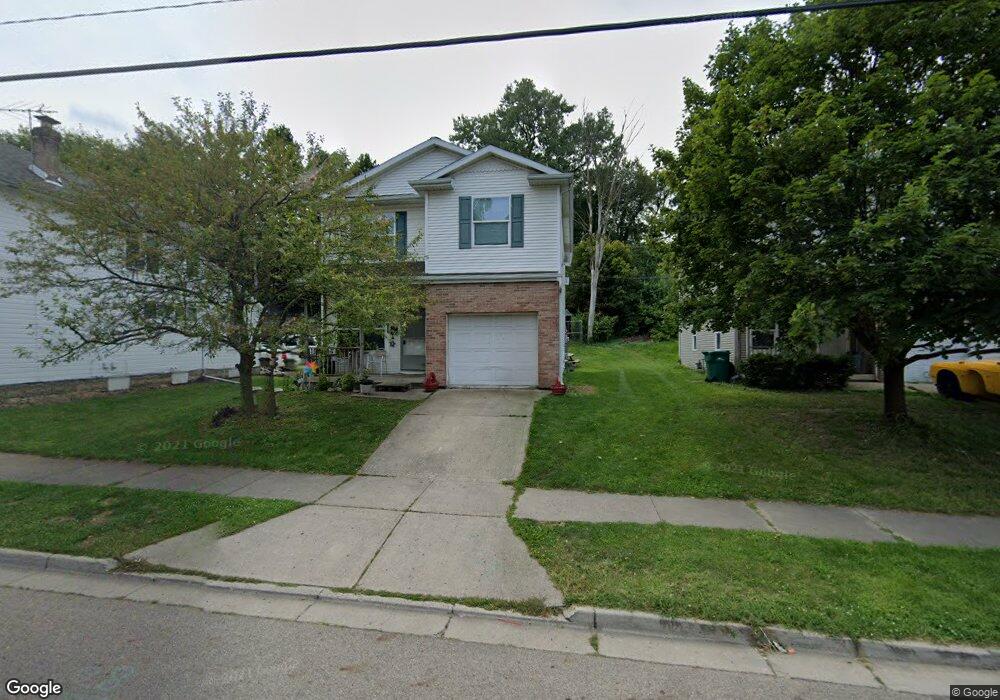
837 E Main St Springfield, OH 45503
Estimated Value: $78,000 - $157,000
4
Beds
2
Baths
1,612
Sq Ft
$68/Sq Ft
Est. Value
About This Home
This home is located at 837 E Main St, Springfield, OH 45503 and is currently estimated at $110,080, approximately $68 per square foot. 837 E Main St is a home located in Clark County with nearby schools including Kenwood Elementary School, Schaefer Middle School, and Springfield High School.
Ownership History
Date
Name
Owned For
Owner Type
Purchase Details
Closed on
Nov 29, 2021
Sold by
Dennis Jeffrey
Bought by
Springfield Houses Llc
Current Estimated Value
Home Financials for this Owner
Home Financials are based on the most recent Mortgage that was taken out on this home.
Original Mortgage
$2,128,000
Outstanding Balance
$1,941,449
Interest Rate
2.98%
Mortgage Type
Commercial
Estimated Equity
-$1,831,369
Purchase Details
Closed on
Mar 30, 1993
Create a Home Valuation Report for This Property
The Home Valuation Report is an in-depth analysis detailing your home's value as well as a comparison with similar homes in the area
Home Values in the Area
Average Home Value in this Area
Purchase History
| Date | Buyer | Sale Price | Title Company |
|---|---|---|---|
| Springfield Houses Llc | -- | Allodial Title Llc | |
| -- | $1,000 | -- |
Source: Public Records
Mortgage History
| Date | Status | Borrower | Loan Amount |
|---|---|---|---|
| Open | Springfield Houses Llc | $2,128,000 |
Source: Public Records
Tax History
| Year | Tax Paid | Tax Assessment Tax Assessment Total Assessment is a certain percentage of the fair market value that is determined by local assessors to be the total taxable value of land and additions on the property. | Land | Improvement |
|---|---|---|---|---|
| 2025 | $265 | $7,180 | $2,780 | $4,400 |
| 2024 | $258 | $5,220 | $2,480 | $2,740 |
| 2023 | $258 | $5,220 | $2,480 | $2,740 |
| 2022 | $264 | $5,220 | $2,480 | $2,740 |
| 2021 | $1,478 | $26,900 | $1,980 | $24,920 |
| 2020 | $1,482 | $26,900 | $1,980 | $24,920 |
| 2019 | $1,485 | $26,900 | $1,980 | $24,920 |
| 2018 | $596 | $10,370 | $1,980 | $8,390 |
| 2017 | $596 | $24,605 | $1,981 | $22,624 |
| 2016 | $597 | $24,605 | $1,981 | $22,624 |
| 2015 | $609 | $27,157 | $1,981 | $25,176 |
| 2014 | $606 | $27,157 | $1,981 | $25,176 |
| 2013 | $1,570 | $27,157 | $1,981 | $25,176 |
Source: Public Records
Map
Nearby Homes
- 802 Warder St
- 1065 Mound St Unit 1067
- 1215 E High St
- 1105 Farlow St
- 453 E Pleasant St
- 418 Linden Ave
- 315 Glenn Ave
- 321 Glenn Ave
- 360 S Greenmount Ave
- 718 Summer St
- 1223 Lagonda Ave
- 625 Tibbetts Ave
- 705 York St
- 1585 Mound St
- 1621 Morgan St
- 726 E Madison Ave
- 1664 Warder St
- 411 S Limestone St
- 836-838 Rodgers Dr
- 1609 Irwin Ave
- 827 E Main St
- 839 E Main St
- 823 E Main St
- 817 E Main St
- 817-819 E Main St
- 828 E Main St
- 826 E Main St
- 251 Lagonda Ave
- 10 Lagonda Ave
- 13 Lagonda Ave
- 864 E Main St
- 14 S Sycamore St
- 21 Lagonda Ave
- 20 Lagonda Ave
- 835 E Columbia St
- 739 E Main St
- 2628 Lagonda Ave
- 33 Lagonda Ave Unit 35
- 735 E Main St
- 32 Lagonda Ave
Your Personal Tour Guide
Ask me questions while you tour the home.