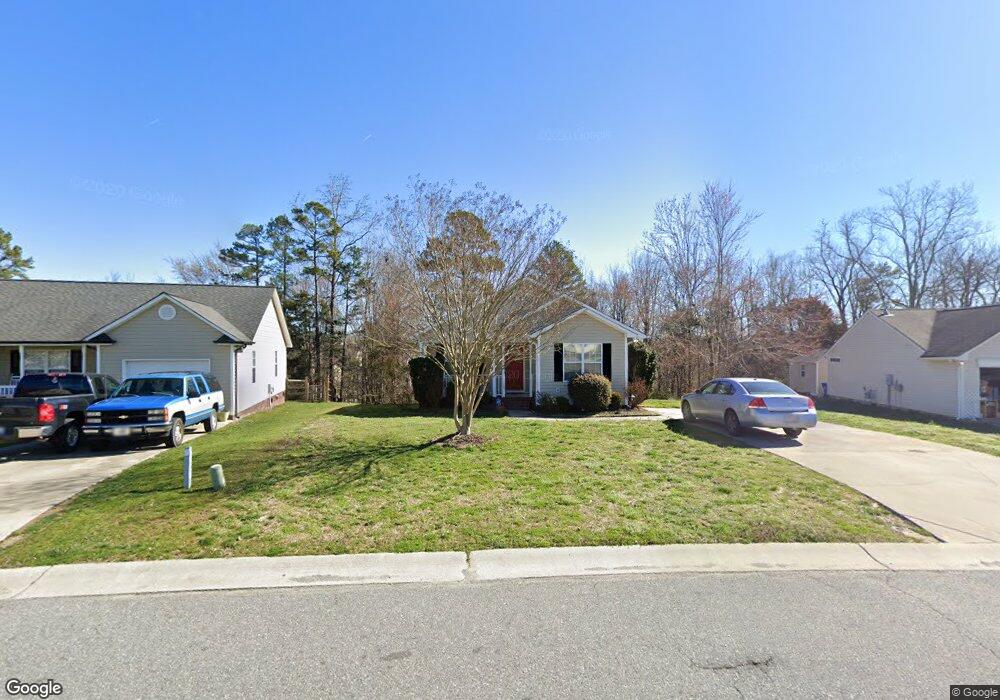
837 Loch Lomond Cir Concord, NC 28025
Estimated Value: $281,479 - $290,000
3
Beds
2
Baths
1,108
Sq Ft
$257/Sq Ft
Est. Value
About This Home
This home is located at 837 Loch Lomond Cir, Concord, NC 28025 and is currently estimated at $284,370, approximately $256 per square foot. 837 Loch Lomond Cir is a home located in Cabarrus County with nearby schools including Patriots Elementary School, C.C. Griffin Middle School, and Central Cabarrus High School.
Ownership History
Date
Name
Owned For
Owner Type
Purchase Details
Closed on
Aug 8, 2019
Sold by
Fry Laura E
Bought by
Cagle Steven A
Current Estimated Value
Home Financials for this Owner
Home Financials are based on the most recent Mortgage that was taken out on this home.
Original Mortgage
$25,200
Interest Rate
3.73%
Mortgage Type
Unknown
Purchase Details
Closed on
Dec 11, 2001
Sold by
We Do Construction Llc
Bought by
Cagle Mary Ann
Home Financials for this Owner
Home Financials are based on the most recent Mortgage that was taken out on this home.
Original Mortgage
$40,000
Interest Rate
6.5%
Purchase Details
Closed on
Aug 28, 2001
Sold by
Twls Inc
Bought by
We Do Construction Llc
Create a Home Valuation Report for This Property
The Home Valuation Report is an in-depth analysis detailing your home's value as well as a comparison with similar homes in the area
Home Values in the Area
Average Home Value in this Area
Purchase History
| Date | Buyer | Sale Price | Title Company |
|---|---|---|---|
| Cagle Steven A | -- | None Available | |
| Cagle Mary Ann | $103,000 | -- | |
| We Do Construction Llc | $53,000 | -- |
Source: Public Records
Mortgage History
| Date | Status | Borrower | Loan Amount |
|---|---|---|---|
| Closed | Cagle Steven A | $25,200 | |
| Closed | Cagle Mary Ann | $40,000 |
Source: Public Records
Tax History Compared to Growth
Tax History
| Year | Tax Paid | Tax Assessment Tax Assessment Total Assessment is a certain percentage of the fair market value that is determined by local assessors to be the total taxable value of land and additions on the property. | Land | Improvement |
|---|---|---|---|---|
| 2025 | $1,850 | $269,650 | $61,000 | $208,650 |
| 2024 | $1,850 | $269,650 | $61,000 | $208,650 |
| 2023 | $1,300 | $152,890 | $40,000 | $112,890 |
| 2022 | $1,269 | $152,890 | $40,000 | $112,890 |
| 2021 | $1,246 | $152,890 | $40,000 | $112,890 |
| 2020 | $1,246 | $152,890 | $40,000 | $112,890 |
| 2019 | $901 | $110,590 | $20,000 | $90,590 |
| 2018 | $885 | $111,370 | $20,000 | $91,370 |
| 2017 | $841 | $111,370 | $20,000 | $91,370 |
| 2016 | $420 | $100,000 | $20,000 | $80,000 |
| 2015 | $373 | $100,000 | $20,000 | $80,000 |
| 2014 | $373 | $100,000 | $20,000 | $80,000 |
Source: Public Records
Map
Nearby Homes
- 1009 Braxton Dr
- 5052 Daffodil Ln
- 4813 Adamshire Ave
- 5248 Ellie Ct
- 1001 Loch Lomond Cir
- 5582 Flowes Store Rd
- 1130 Brigadoon Ct
- 876 Pointe Andrews Dr
- 707 Pointe Andrews Dr SW
- 660 Pointe Andrews Dr
- 4425 Norfleet St
- 1025 Jeffrey Ct SW
- 137 Softwind Ln
- 5917 Ashebrook Dr
- 3931 Kellybrook Dr
- 123 Softwind Ln
- 5822 Meeting St
- 4194 Clifftonville Ave SW
- 6001 Firethorne Ln
- 1051 Manston Place SW
- 831 Loch Lomond Cir
- 843 Loch Lomond Cir
- 825 Loch Lomond Cir
- 849 Loch Lomond Cir
- 822 Loch Lomond Cir
- 838 Loch Lomond Cir
- 5091 Daffodil Ln
- 819 Loch Lomond Cir
- 855 Loch Lomond Cir
- 844 Loch Lomond Cir
- 5095 Daffodil Ln
- 969 Braxton Dr
- 965 Braxton Dr
- 814 Loch Lomond Cir
- 975 Braxton Dr
- 979 Braxton Dr
- 813 Loch Lomond Cir
- 854 Loch Lomond Cir
- 5099 Daffodil Ln
- 5090 Daffodil Ln