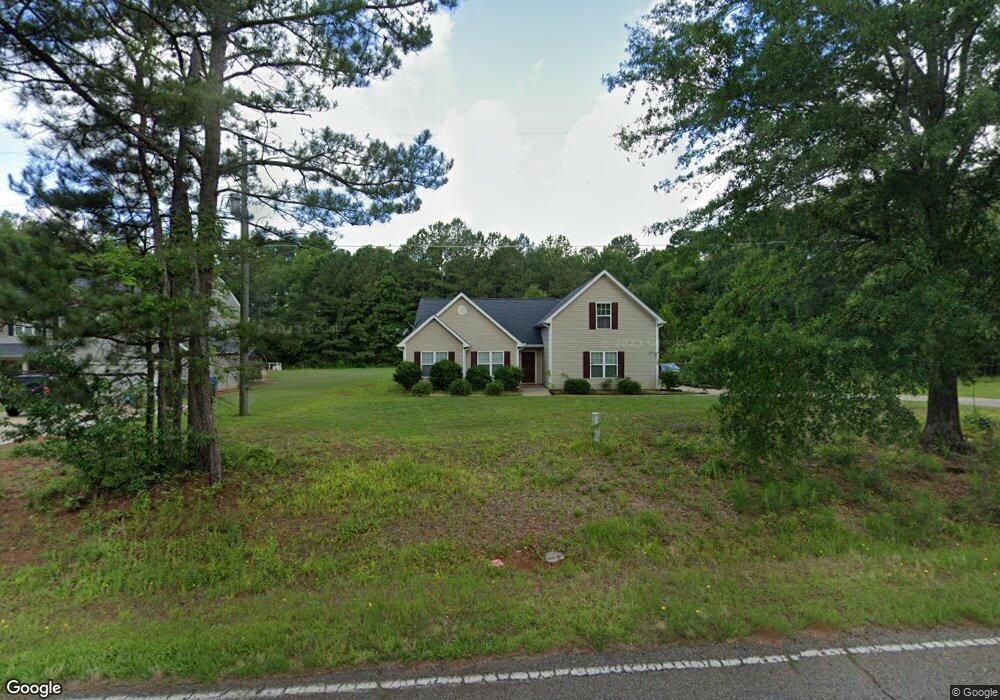
837 Manning Gin Rd Monroe, GA 30656
Estimated Value: $268,695 - $364,000
--
Bed
4
Baths
1,240
Sq Ft
$254/Sq Ft
Est. Value
About This Home
This home is located at 837 Manning Gin Rd, Monroe, GA 30656 and is currently estimated at $315,174, approximately $254 per square foot. 837 Manning Gin Rd is a home located in Barrow County with nearby schools including Bethlehem Elementary School, Haymon-Morris Middle School, and Apalachee High School.
Ownership History
Date
Name
Owned For
Owner Type
Purchase Details
Closed on
Oct 23, 2015
Sold by
Stinson Robert Duane
Bought by
Bennett Patricia M
Current Estimated Value
Home Financials for this Owner
Home Financials are based on the most recent Mortgage that was taken out on this home.
Original Mortgage
$102,306
Outstanding Balance
$81,490
Interest Rate
4.25%
Mortgage Type
FHA
Estimated Equity
$233,684
Purchase Details
Closed on
Mar 9, 2011
Sold by
Capital Mortgage Corp
Bought by
Stinson Robert Duane
Purchase Details
Closed on
Sep 30, 2009
Sold by
First Financial Funding Inc
Bought by
Capital Mortgage Corp
Purchase Details
Closed on
Nov 25, 2008
Sold by
Capital
Bought by
First Financial Funding Inc
Purchase Details
Closed on
Oct 3, 2006
Sold by
Carswell Bernice D
Bought by
Capital Mtg Corp
Purchase Details
Closed on
Mar 30, 1979
Bought by
Carswell Bernice
Create a Home Valuation Report for This Property
The Home Valuation Report is an in-depth analysis detailing your home's value as well as a comparison with similar homes in the area
Home Values in the Area
Average Home Value in this Area
Purchase History
| Date | Buyer | Sale Price | Title Company |
|---|---|---|---|
| Bennett Patricia M | $105,000 | -- | |
| Stinson Robert Duane | $124,200 | -- | |
| Capital Mortgage Corp | -- | -- | |
| First Financial Funding Inc | -- | -- | |
| Capital Mtg Corp | $211,461 | -- | |
| Capital Mortgage Corp | -- | -- | |
| Carswell Bernice | $9,500 | -- |
Source: Public Records
Mortgage History
| Date | Status | Borrower | Loan Amount |
|---|---|---|---|
| Open | Bennett Patricia M | $102,306 |
Source: Public Records
Tax History Compared to Growth
Tax History
| Year | Tax Paid | Tax Assessment Tax Assessment Total Assessment is a certain percentage of the fair market value that is determined by local assessors to be the total taxable value of land and additions on the property. | Land | Improvement |
|---|---|---|---|---|
| 2024 | $1,282 | $54,098 | $18,000 | $36,098 |
| 2023 | $865 | $54,098 | $18,000 | $36,098 |
| 2022 | $1,038 | $38,623 | $18,000 | $20,623 |
| 2021 | $832 | $30,144 | $11,040 | $19,104 |
| 2020 | $831 | $30,144 | $11,040 | $19,104 |
| 2019 | $845 | $30,144 | $11,040 | $19,104 |
| 2018 | $825 | $30,144 | $11,040 | $19,104 |
| 2017 | $782 | $26,868 | $11,040 | $15,828 |
| 2016 | $697 | $26,868 | $11,040 | $15,828 |
| 2015 | $2,045 | $71,226 | $24,168 | $47,058 |
| 2014 | $1,717 | $59,434 | $11,842 | $47,592 |
| 2013 | -- | $56,857 | $11,842 | $45,015 |
Source: Public Records
Map
Nearby Homes
- 0 Manning Gin Rd Unit 10529477
- 0 Manning Gin Rd Unit 7585578
- 3629 Perry Smith Rd NW
- 1625 Austin Rd
- 296 Westminster Trail
- 131 Wallace Dr
- 111 Mockingbird Ln Unit 15
- 3300 Jack Glass Rd
- 159 Mockingbird Ln Unit 16
- 142 Brockton Way Unit 9
- 199 Mockingbird Ln Unit 17
- 225 Mockingbird Ln Unit 18
- 247 Mockingbird Ln Unit 19
- 271 Mockingbird Ln Unit 20
- 291 Mockingbird Ln Unit 21
- 101 Westminster Ct
- 140 Westminster Ct
- 264 Westminster Ct
- 848 Manning Gin Rd
- 835 Manning Gin Rd
- 754 Manning Gin Rd
- 1700 Jeremy Dr
- 1004 Smith Chapel Rd
- 1706 Jeremy Dr
- 1704 Jeremy Dr
- 812 Manning Gin Rd
- 1701 Jeremy Dr
- 1015 Smith Chapel Rd
- 806 Manning Gin Rd
- 1703 Jeremy Dr
- 1006 Smith Chapel Rd
- 1705 Jeremy Dr
- 1017 Smith Chapel Rd Unit 2
- 1017 Smith Chapel Rd
- 1707 Jeremy Dr Unit 1/04
- 1707 Jeremy Dr
- 1708 Jeremy Dr
- 1010 Smith Chapel Rd