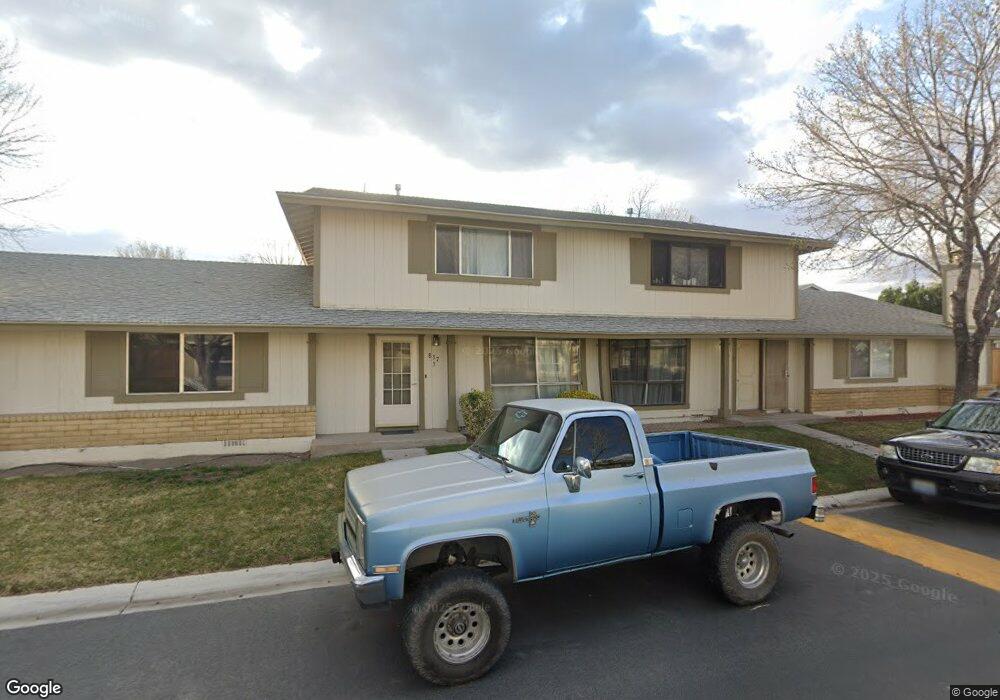
837 Mesa Ridge Dr Unit 1 Sparks, NV 89434
O'Callaghan NeighborhoodEstimated Value: $233,515 - $274,000
2
Beds
1
Bath
936
Sq Ft
$274/Sq Ft
Est. Value
About This Home
This home is located at 837 Mesa Ridge Dr Unit 1, Sparks, NV 89434 and is currently estimated at $256,379, approximately $273 per square foot. 837 Mesa Ridge Dr Unit 1 is a home located in Washoe County with nearby schools including Katherine Dunn Elementary School, George L Dilworth Middle School, and Edward C Reed High School.
Ownership History
Date
Name
Owned For
Owner Type
Purchase Details
Closed on
Jul 30, 2002
Sold by
Connelly Joy Anne
Bought by
Owens Yolanda S
Current Estimated Value
Home Financials for this Owner
Home Financials are based on the most recent Mortgage that was taken out on this home.
Original Mortgage
$89,240
Outstanding Balance
$36,806
Interest Rate
6.6%
Mortgage Type
FHA
Estimated Equity
$219,573
Purchase Details
Closed on
May 24, 1999
Sold by
Krentz Darrel
Bought by
Connelly Joy Anne
Home Financials for this Owner
Home Financials are based on the most recent Mortgage that was taken out on this home.
Original Mortgage
$82,106
Interest Rate
6.86%
Mortgage Type
FHA
Purchase Details
Closed on
May 15, 1997
Sold by
Henley C Lynn and Lynn Casburn C
Bought by
Krentz Darrel
Create a Home Valuation Report for This Property
The Home Valuation Report is an in-depth analysis detailing your home's value as well as a comparison with similar homes in the area
Home Values in the Area
Average Home Value in this Area
Purchase History
| Date | Buyer | Sale Price | Title Company |
|---|---|---|---|
| Owens Yolanda S | $92,000 | First American Title | |
| Connelly Joy Anne | $82,500 | Founders Title Co | |
| Krentz Darrel | -- | -- |
Source: Public Records
Mortgage History
| Date | Status | Borrower | Loan Amount |
|---|---|---|---|
| Open | Owens Yolanda S | $89,240 | |
| Previous Owner | Connelly Joy Anne | $82,106 | |
| Closed | Owens Yolanda S | $5,200 |
Source: Public Records
Tax History Compared to Growth
Tax History
| Year | Tax Paid | Tax Assessment Tax Assessment Total Assessment is a certain percentage of the fair market value that is determined by local assessors to be the total taxable value of land and additions on the property. | Land | Improvement |
|---|---|---|---|---|
| 2026 | $462 | $34,666 | $20,930 | $13,736 |
| 2025 | $603 | $36,361 | $22,855 | $13,506 |
| 2024 | $603 | $34,043 | $20,370 | $13,673 |
| 2023 | $586 | $31,556 | $19,775 | $11,781 |
| 2022 | $571 | $27,828 | $17,395 | $10,433 |
| 2021 | $572 | $22,292 | $11,515 | $10,777 |
| 2020 | $545 | $22,859 | $11,620 | $11,239 |
| 2019 | $525 | $22,261 | $10,955 | $11,306 |
| 2018 | $504 | $18,207 | $6,825 | $11,382 |
| 2017 | $489 | $18,798 | $7,175 | $11,623 |
| 2016 | $477 | $17,181 | $5,005 | $12,176 |
| 2015 | $476 | $16,882 | $4,200 | $12,682 |
| 2014 | $445 | $15,544 | $3,745 | $11,799 |
| 2013 | -- | $11,854 | $2,030 | $9,824 |
Source: Public Records
Map
Nearby Homes
- 828 Woodglen Dr Unit 2
- 801 Woodglen Dr Unit 2
- 949 Crestwood Dr Unit 3
- 1029 Brooktree Dr Unit 1
- 684 Oakwood Dr Unit 3
- 907 Camino Real Dr
- 370 O'Brien Way
- 611 Oakwood Dr Unit 1
- 604 Oakwood Dr Unit 1
- 601 Oakwood Dr Unit 4
- 360 E Lincoln Way
- 675 Parlanti Ln Unit 52
- 675 Parlanti Ln Unit 124
- 675 Parlanti Ln Unit 42
- 675 Parlanti Ln
- 675 Parlanti Ln Unit 88
- 675 Parlanti Ln Unit 63
- 445 Pine Meadows Dr Unit E25
- 560 Nichols Blvd
- 1218 Junction Dr
- 837 Mesa Ridge Dr
- 837 Mesa Ridge Dr Unit 1
- 837 Mesa Ridge Dr Unit 1
- 837 Mesa Ridge Dr Unit 2
- 837 Mesa Ridge Dr Unit 3
- 828 Woodglen Dr #2 Unit 2
- 805 Mesa Ridge Dr
- 805 Mesa Ridge Dr
- 805 Mesa Ridge Dr
- 805 Mesa Ridge Dr
- 805 Mesa Ridge Dr Unit 4
- 805 Mesa Ridge Dr Unit 2
- 805 Mesa Ridge Dr Unit 3
- 805 Mesa Ridge Dr Unit 1
- 832 Mesa Ridge Dr Unit 2
- 832 Mesa Ridge Dr Unit 3
- 832 Mesa Ridge Dr
- 832 Mesa Ridge Dr
- 832 Mesa Ridge Dr
- 832 Mesa Ridge Dr