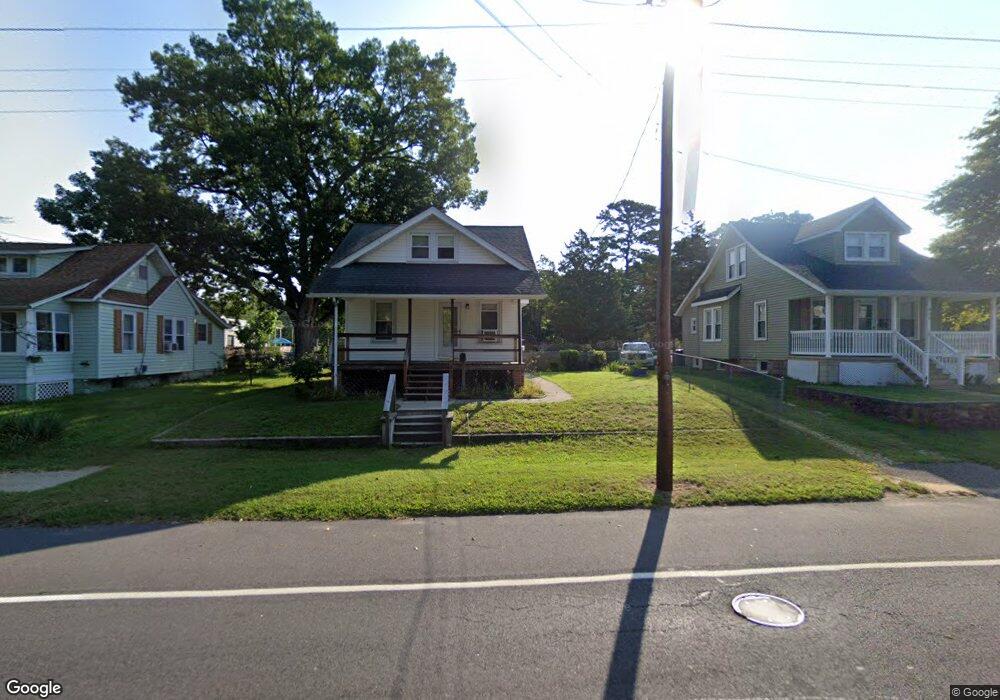
837 S 2nd St Millville, NJ 08332
Estimated Value: $135,825 - $204,000
--
Bed
--
Bath
796
Sq Ft
$223/Sq Ft
Est. Value
About This Home
This home is located at 837 S 2nd St, Millville, NJ 08332 and is currently estimated at $177,706, approximately $223 per square foot. 837 S 2nd St is a home located in Cumberland County with nearby schools including R.M. Bacon Elementary School, Lakeside Middle School, and Memorial High School.
Ownership History
Date
Name
Owned For
Owner Type
Purchase Details
Closed on
Apr 2, 2002
Current Estimated Value
Purchase Details
Closed on
Jun 28, 1996
Sold by
Page Janet R and Billings Mary Jane
Bought by
Hoffman Mary
Purchase Details
Closed on
Jun 26, 1996
Sold by
Hoffman Dale
Bought by
Hoffman Mary
Purchase Details
Closed on
Apr 30, 1996
Sold by
Tomlin Millicent W and Page Janet R
Bought by
Page Janet R and Billings Mary Jane
Create a Home Valuation Report for This Property
The Home Valuation Report is an in-depth analysis detailing your home's value as well as a comparison with similar homes in the area
Home Values in the Area
Average Home Value in this Area
Purchase History
| Date | Buyer | Sale Price | Title Company |
|---|---|---|---|
| -- | $100 | -- | |
| Hoffman Mary | $40,000 | Beacon Title Services Agency | |
| Hoffman Mary | -- | Beacon Title Services Agency | |
| Page Janet R | -- | -- |
Source: Public Records
Tax History Compared to Growth
Tax History
| Year | Tax Paid | Tax Assessment Tax Assessment Total Assessment is a certain percentage of the fair market value that is determined by local assessors to be the total taxable value of land and additions on the property. | Land | Improvement |
|---|---|---|---|---|
| 2025 | $3,073 | $78,300 | $29,800 | $48,500 |
| 2024 | $3,073 | $78,300 | $29,800 | $48,500 |
| 2023 | $3,047 | $78,300 | $29,800 | $48,500 |
| 2022 | $2,968 | $78,300 | $29,800 | $48,500 |
| 2021 | $2,651 | $78,300 | $29,800 | $48,500 |
| 2020 | $2,824 | $78,300 | $29,800 | $48,500 |
| 2019 | $2,694 | $78,300 | $29,800 | $48,500 |
| 2018 | $2,638 | $78,300 | $29,800 | $48,500 |
| 2017 | $2,614 | $78,300 | $29,800 | $48,500 |
| 2016 | $2,581 | $78,300 | $29,800 | $48,500 |
| 2015 | $2,523 | $78,300 | $29,800 | $48,500 |
| 2014 | $2,528 | $78,300 | $29,800 | $48,500 |
Source: Public Records
Map
Nearby Homes