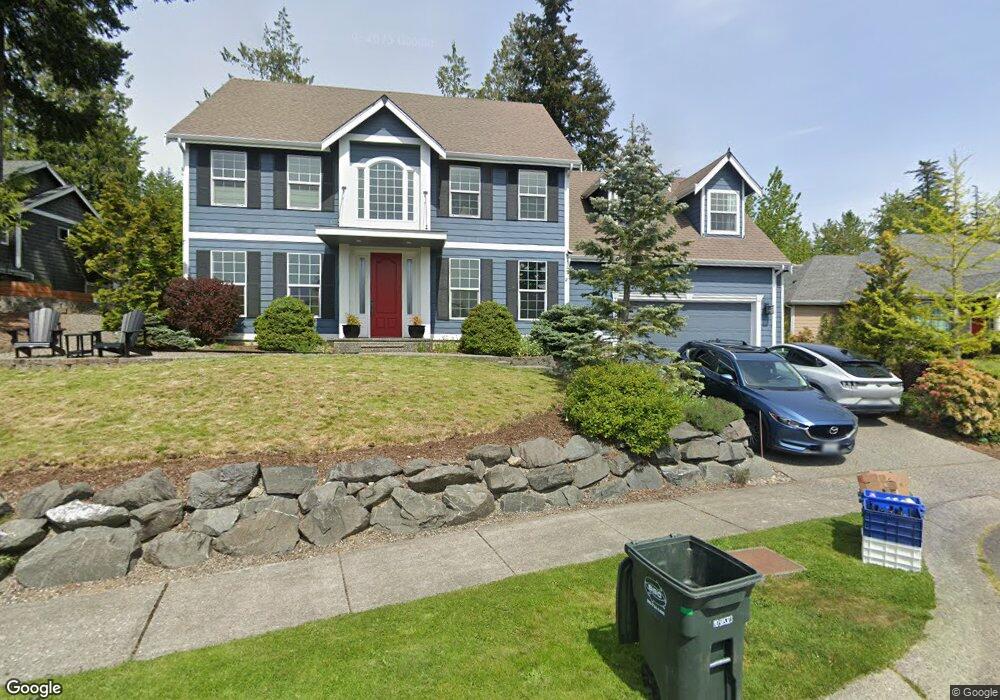
837 S Hills Dr Bellingham, WA 98229
Estimated Value: $953,000 - $1,049,000
3
Beds
3
Baths
2,449
Sq Ft
$404/Sq Ft
Est. Value
About This Home
This home is located at 837 S Hills Dr, Bellingham, WA 98229 and is currently estimated at $989,739, approximately $404 per square foot. 837 S Hills Dr is a home located in Whatcom County with nearby schools including Wade King Elementary School, Fairhaven Middle School, and Sehome High School.
Ownership History
Date
Name
Owned For
Owner Type
Purchase Details
Closed on
Apr 24, 2020
Sold by
Lunny Christin A
Bought by
Lunny Christin A and Lunny Andrew D
Current Estimated Value
Home Financials for this Owner
Home Financials are based on the most recent Mortgage that was taken out on this home.
Original Mortgage
$303,000
Outstanding Balance
$269,426
Interest Rate
3.6%
Mortgage Type
New Conventional
Estimated Equity
$720,313
Purchase Details
Closed on
Jan 6, 2005
Sold by
Roger Jocelyn
Bought by
Roger Christin A
Home Financials for this Owner
Home Financials are based on the most recent Mortgage that was taken out on this home.
Original Mortgage
$50,000
Interest Rate
5.8%
Mortgage Type
Credit Line Revolving
Purchase Details
Closed on
Sep 11, 2003
Sold by
Skeers Construction Inc
Bought by
Roger Jocelyn and Roger Christin
Home Financials for this Owner
Home Financials are based on the most recent Mortgage that was taken out on this home.
Original Mortgage
$235,000
Interest Rate
6.06%
Mortgage Type
Purchase Money Mortgage
Create a Home Valuation Report for This Property
The Home Valuation Report is an in-depth analysis detailing your home's value as well as a comparison with similar homes in the area
Home Values in the Area
Average Home Value in this Area
Purchase History
| Date | Buyer | Sale Price | Title Company |
|---|---|---|---|
| Lunny Christin A | -- | Whatcom Land Title | |
| Roger Christin A | -- | Chicago Title Insurance | |
| Roger Jocelyn | $278,078 | Chicago Title Insurance |
Source: Public Records
Mortgage History
| Date | Status | Borrower | Loan Amount |
|---|---|---|---|
| Open | Lunny Christin A | $303,000 | |
| Closed | Roger Christin A | $50,000 | |
| Closed | Roger Jocelyn | $235,000 |
Source: Public Records
Tax History Compared to Growth
Tax History
| Year | Tax Paid | Tax Assessment Tax Assessment Total Assessment is a certain percentage of the fair market value that is determined by local assessors to be the total taxable value of land and additions on the property. | Land | Improvement |
|---|---|---|---|---|
| 2024 | $7,435 | $857,129 | $295,645 | $561,484 |
| 2023 | $7,435 | $887,773 | $306,215 | $581,558 |
| 2022 | $6,430 | $755,556 | $260,610 | $494,946 |
| 2021 | $5,726 | $609,336 | $210,175 | $399,161 |
| 2020 | $5,606 | $534,501 | $184,363 | $350,138 |
| 2019 | $5,371 | $507,357 | $175,000 | $332,357 |
| 2018 | $5,597 | $487,840 | $155,155 | $332,685 |
| 2017 | $4,945 | $433,028 | $137,720 | $295,308 |
| 2016 | $4,480 | $398,812 | $126,720 | $272,092 |
| 2015 | $4,398 | $378,282 | $120,120 | $258,162 |
| 2014 | -- | $360,257 | $114,400 | $245,857 |
| 2013 | -- | $342,160 | $110,000 | $232,160 |
Source: Public Records
Map
Nearby Homes
- 955 Colony Ct
- 4915 Samish Way Unit 60
- 4915 Samish Way Unit 66
- 2010 Samish Crest Way
- 750 Samish Way
- 4949 Samish Way Unit 6
- 4203 Harrison St
- 2284 Yew Street Rd Unit B6
- 2316 Yew Street Rd
- 1800 40th Place
- 2500 Samish Way Unit 50
- 2500 Samish Way Unit 13
- 2604 S 42nd St
- 2600 42nd
- 2608 S 42nd St
- 921 Whitewater Dr
- 1615 Samish Way
- 840 Reveille St
- 3605 Mill Ave
- 2490 Autumnwood Ct
- 833 S Hills Dr
- 841 S Hills Dr
- 834 S Hills Dr
- 829 S Hills Dr
- 845 S Hills Dr
- 848 S Hills Dr
- 849 S Hills Dr
- 830 S Hills Dr
- 825 S Hills Dr
- 2004 Edgefield Dr
- 826 S Hills Dr
- 853 S Hills Dr
- 2000 Edgefield Dr
- 1972 N Springfield Ct
- 2010 Governor Rd
- 1996 Edgefield Dr
- 1968 N Springfield Ct
- 821 S Hills Dr
- 2008 Edgefield Dr
- 1992 Edgefield Dr