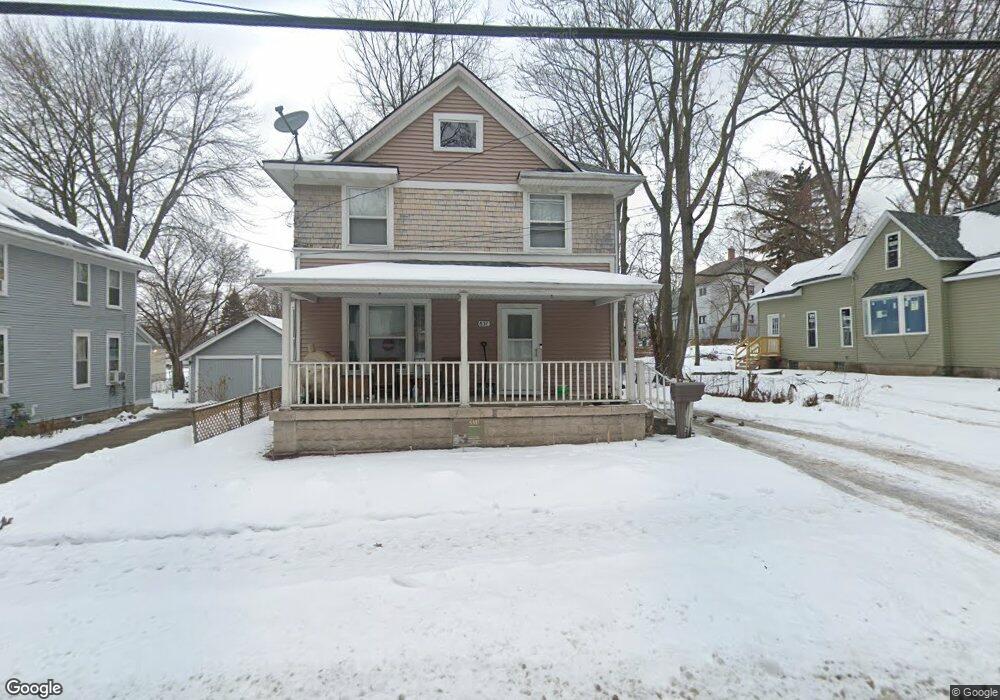
837 Thomas St SE Grand Rapids, MI 49506
Baxter NeighborhoodEstimated Value: $220,000 - $293,000
4
Beds
2
Baths
1,786
Sq Ft
$145/Sq Ft
Est. Value
About This Home
This home is located at 837 Thomas St SE, Grand Rapids, MI 49506 and is currently estimated at $259,787, approximately $145 per square foot. 837 Thomas St SE is a home located in Kent County with nearby schools including Martin Luther King Leadership Academy, Alger Middle School, and Ottawa Hills High School.
Ownership History
Date
Name
Owned For
Owner Type
Purchase Details
Closed on
May 9, 2011
Sold by
Secretary Of Housing & Urban Development
Bought by
Miller Jones Stesha
Current Estimated Value
Purchase Details
Closed on
Feb 22, 2011
Sold by
Michigan State Housing Development Autho
Bought by
Secretary Of Housing & Urban Development
Purchase Details
Closed on
Sep 8, 2010
Sold by
Spears Ronald D
Bought by
Michigan State Housing Development Autho
Purchase Details
Closed on
Sep 23, 1996
Purchase Details
Closed on
Sep 10, 1996
Bought by
Miller-Jones Spears R and Miller-Jones Stesha
Purchase Details
Closed on
Jan 13, 1994
Purchase Details
Closed on
Dec 6, 1993
Sold by
City Dnr and City Gr
Bought by
Miller-Jones Stesha
Purchase Details
Closed on
May 5, 1992
Sold by
Bowman Bowman L L and Bowman Dnr
Bought by
Miller-Jones Stesha
Create a Home Valuation Report for This Property
The Home Valuation Report is an in-depth analysis detailing your home's value as well as a comparison with similar homes in the area
Home Values in the Area
Average Home Value in this Area
Purchase History
| Date | Buyer | Sale Price | Title Company |
|---|---|---|---|
| Miller Jones Stesha | $26,250 | None Available | |
| Secretary Of Housing & Urban Development | -- | None Available | |
| Michigan State Housing Development Autho | $38,705 | None Available | |
| -- | -- | -- | |
| Miller-Jones Spears R | $42,000 | -- | |
| -- | -- | -- | |
| Miller-Jones Stesha | $100 | -- | |
| Miller-Jones Stesha | -- | -- |
Source: Public Records
Tax History Compared to Growth
Tax History
| Year | Tax Paid | Tax Assessment Tax Assessment Total Assessment is a certain percentage of the fair market value that is determined by local assessors to be the total taxable value of land and additions on the property. | Land | Improvement |
|---|---|---|---|---|
| 2025 | $1,206 | $120,100 | $0 | $0 |
| 2024 | $1,206 | $109,000 | $0 | $0 |
| 2023 | $1,224 | $101,800 | $0 | $0 |
| 2022 | $1,162 | $87,400 | $0 | $0 |
| 2021 | $1,136 | $71,500 | $0 | $0 |
| 2020 | $1,086 | $57,000 | $0 | $0 |
| 2019 | $1,137 | $48,000 | $0 | $0 |
| 2018 | $1,098 | $39,500 | $0 | $0 |
| 2017 | $1,069 | $32,700 | $0 | $0 |
| 2016 | $1,082 | $32,900 | $0 | $0 |
| 2015 | $1,006 | $32,900 | $0 | $0 |
| 2013 | -- | $29,600 | $0 | $0 |
Source: Public Records
Map
Nearby Homes
- 835 Bates St SE
- 853 Geneva Ave SE
- 747 Prince St SE
- 758 Prince St SE
- 910 Prince St SE
- 1053 Martin Luther King Junior St SE
- 940 Eastern Ave SE
- 509 Diamond Ave SE
- 700 Union Ave SE
- 1007 Watkins St SE
- 1000 Logan St SE
- 743 Logan St SE
- 931 Alexander St SE Unit 933
- 1122 Martin Luther King Junior St SE
- 1036 Logan St SE
- 1138 Thomas St SE
- 941 Wealthy St SE
- 427 James Ave SE
- 937 Humbolt St SE
- 436 Martin Luther King Junior St SE
- 833 Thomas St SE
- 847 Thomas St SE
- 836 Dunham St SE
- 840 Dunham St SE
- 832 Dunham St SE
- 853 Thomas St SE
- 836 Thomas St SE
- 842 Thomas St SE
- 832 Thomas St SE
- 852 Dunham St SE
- 842 Dunham St SE
- 842 Dunham St SE Unit 846
- 859 Thomas St SE
- 826 Thomas St SE
- 856 Dunham St SE
- 822 Thomas St SE
- 863 Thomas St SE
- 816 Thomas St SE
- 862 Dunham St SE
- 862 Dunham St SE Unit 1