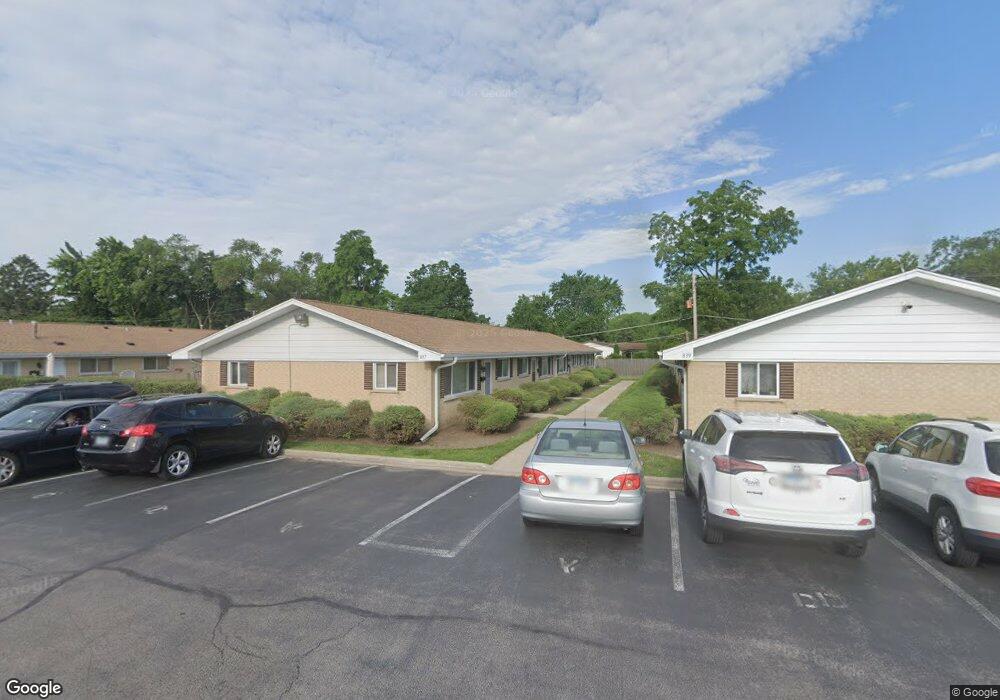
837 Valley Stream Dr Unit 18 Wheeling, IL 60090
Estimated Value: $150,000 - $201,000
2
Beds
--
Bath
1,100
Sq Ft
$171/Sq Ft
Est. Value
About This Home
This home is located at 837 Valley Stream Dr Unit 18, Wheeling, IL 60090 and is currently estimated at $187,891, approximately $170 per square foot. 837 Valley Stream Dr Unit 18 is a home located in Cook County with nearby schools including Eugene Field Elementary School, Jack London Middle School, and Buffalo Grove High School.
Ownership History
Date
Name
Owned For
Owner Type
Purchase Details
Closed on
Feb 22, 2018
Sold by
Zapeda Martin De La Cruz and De La Cruz Graciela
Bought by
Sherman Rachel
Current Estimated Value
Home Financials for this Owner
Home Financials are based on the most recent Mortgage that was taken out on this home.
Original Mortgage
$99,910
Outstanding Balance
$84,375
Interest Rate
4.15%
Mortgage Type
New Conventional
Estimated Equity
$103,516
Purchase Details
Closed on
May 20, 2015
Sold by
Karwal Rakesh K and Karwal Savita
Bought by
Delacruz Zepeda Martin and Delacruz Graciela
Purchase Details
Closed on
Jan 27, 2003
Sold by
Martinez Arnold D
Bought by
Eberle Richard
Purchase Details
Closed on
Oct 28, 1996
Sold by
Salzman Richard
Bought by
Martinez Arnold D
Home Financials for this Owner
Home Financials are based on the most recent Mortgage that was taken out on this home.
Original Mortgage
$71,250
Interest Rate
8.26%
Create a Home Valuation Report for This Property
The Home Valuation Report is an in-depth analysis detailing your home's value as well as a comparison with similar homes in the area
Home Values in the Area
Average Home Value in this Area
Purchase History
| Date | Buyer | Sale Price | Title Company |
|---|---|---|---|
| Sherman Rachel | $103,000 | Attorneys Title Guaranty Fun | |
| Delacruz Zepeda Martin | $55,000 | Regency Title Services Inc | |
| Eberle Richard | $107,000 | Cti | |
| Martinez Arnold D | $75,000 | Attorneys Natl Title Network |
Source: Public Records
Mortgage History
| Date | Status | Borrower | Loan Amount |
|---|---|---|---|
| Open | Sherman Rachel | $99,910 | |
| Previous Owner | Martinez Arnold D | $71,250 |
Source: Public Records
Tax History
| Year | Tax Paid | Tax Assessment Tax Assessment Total Assessment is a certain percentage of the fair market value that is determined by local assessors to be the total taxable value of land and additions on the property. | Land | Improvement |
|---|---|---|---|---|
| 2025 | $3,633 | $16,709 | $2,563 | $14,146 |
| 2024 | $3,633 | $10,841 | $2,136 | $8,705 |
| 2023 | $3,464 | $10,841 | $2,136 | $8,705 |
| 2022 | $3,464 | $10,841 | $2,136 | $8,705 |
| 2021 | $2,523 | $6,810 | $355 | $6,455 |
| 2020 | $2,457 | $6,810 | $355 | $6,455 |
| 2019 | $2,497 | $7,621 | $355 | $7,266 |
| 2018 | $593 | $5,059 | $284 | $4,775 |
| 2017 | $602 | $5,059 | $284 | $4,775 |
| 2016 | $855 | $5,059 | $284 | $4,775 |
| 2015 | $925 | $5,219 | $1,210 | $4,009 |
| 2014 | $921 | $5,219 | $1,210 | $4,009 |
| 2013 | $831 | $5,219 | $1,210 | $4,009 |
Source: Public Records
Map
Nearby Homes
- 813 Valley Stream Dr Unit D
- 822 Colonial Dr Unit B
- 842 Colonial Dr Unit B
- 88 W Wayne Place
- 640 Mchenry Rd Unit 301
- 665 Cindy Ln
- 1052 Southbury Ln Unit 1
- 353 E Norman Ln
- 550 Greystone Ln Unit A2
- 271 Northgate Pkwy Unit 1B
- 575 Greystone Ln Unit A2
- 1321 Marcy Ln
- 1157 Middlebury Ln Unit 1
- 1050 Driftwood Ct Unit 1
- 492 Bernice Ct
- 1410 Tulip Ct Unit D2
- 350 E Dundee Rd Unit 207B
- 586 Fairway View Dr Unit 2C
- 475 E Merle Ln
- 175 Lake Blvd Unit 349
- 837 Valley Stream Dr Unit 18
- 837 Valley Stream Dr Unit 18
- 837 Valley Stream Dr Unit 18
- 837 Valley Stream Dr Unit B
- 837 Valley Stream Dr Unit D
- 839 Valley Stream Dr Unit 19
- 839 Valley Stream Dr Unit 19
- 839 Valley Stream Dr Unit 19
- 839 Valley Stream Dr Unit 19
- 839 Valley Stream Dr Unit A
- 839 Valley Stream Dr Unit B
- 839 Valley Stream Dr Unit C
- 835 Valley Stream Dr Unit C
- 835 Valley Stream Dr Unit 17
- 835 Valley Stream Dr Unit 17
- 835 Valley Stream Dr Unit 17
- 835 Valley Stream Dr Unit 17
- 835 Valley Stream Dr Unit B
- 833 Valley Stream Dr Unit 16
- 833 Valley Stream Dr Unit 16
Your Personal Tour Guide
Ask me questions while you tour the home.