
Landlord's Agent in 2020
Pia Castagnino
Samson Properties
(703) 989-0362
1 in this area
29 Total Sales
Estimated Value: $679,000 - $771,000
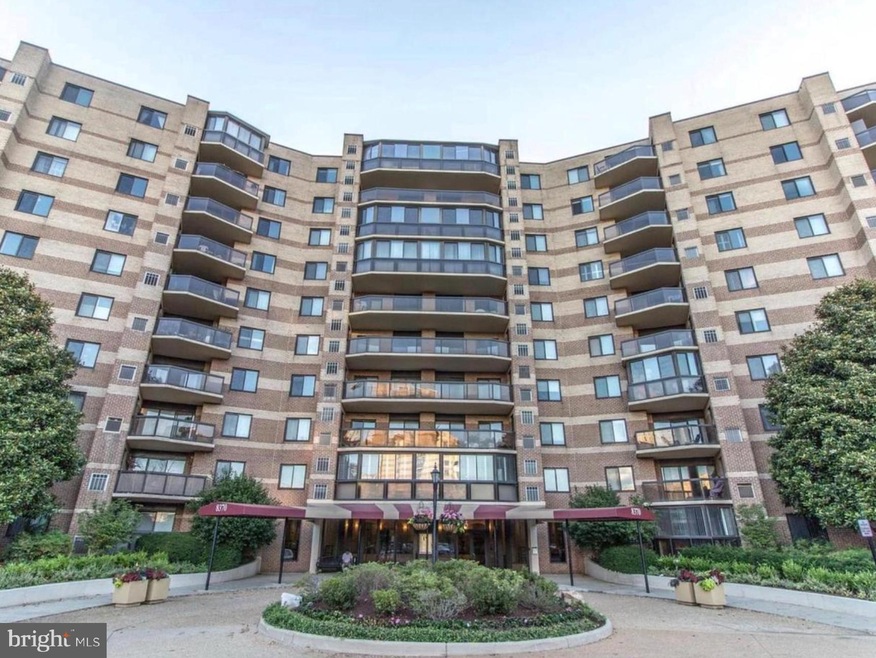
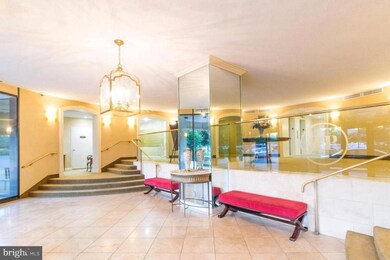
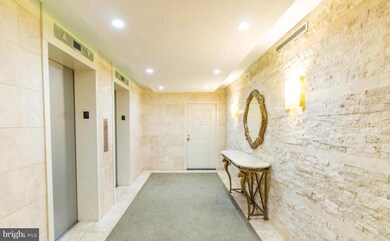
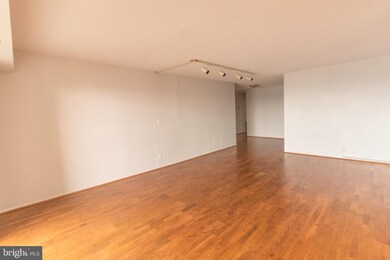
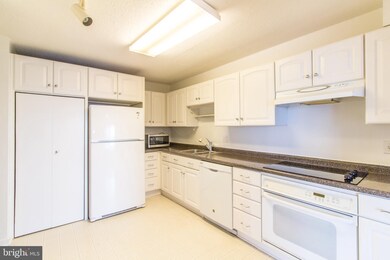
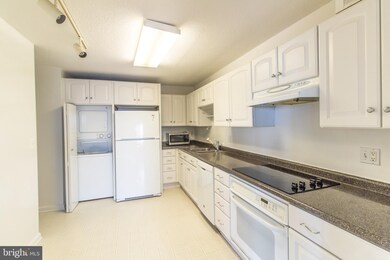
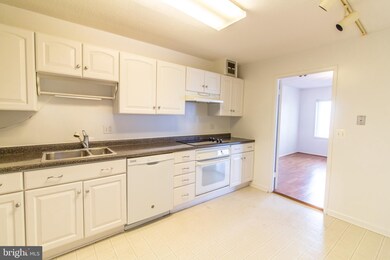
HIGHLY DESIRED COMMUNITY- ROTONDA-- in the heart of Tysons. Charming, naturally well-lit 3 bedrooms 2-bathroom condo. Breathtaking views from both balconies on the 9th floor, wood floors throughout the condo, bright eat-in-kitchen, plenty of closets space, living room space with separate dining room area, one covered parking garage, plenty of parking in the community and storage room, Water is included. Enjoy the Fantastic amenities such as the newly renovated fitness center with yoga room, game room, billiard Room, indoor and outdoor pools, hot tub, sauna, 24-hour security gate, library, soccer field, tennis court, basketball court, walking trail, tot lots, convenience store and more!. Conveniently located walking distance to 3 Metro stations (Springhill, Greensboro, Tysons) commuter shuttle to the metro and walking distance to The Boro new stores, restaurants and Whole Foods. A MUST SEE!
Last Agent to Rent the Property
(703) 989-0362 pia.castagnino@gmail.com Samson Properties License #0225200218 Listed on: 07/04/2020
Last Renter's Agent
datacorrect@brightmls.com Non Subscribing Office License #0225194075
| Date | Buyer | Sale Price | Title Company |
|---|---|---|---|
| Sharara Mohamed | $565,000 | -- |
| Date | Status | Borrower | Loan Amount |
|---|---|---|---|
| Open | Sharara Mohamed | $215,000 |
| Date | Event | Price | List to Sale | Price per Sq Ft | Prior Sale |
|---|---|---|---|---|---|
| 07/18/2020 07/18/20 | Rented | $3,000 | 0.0% | -- | |
| 07/14/2020 07/14/20 | Under Contract | -- | -- | -- | |
| 07/04/2020 07/04/20 | For Rent | $3,000 | 0.0% | -- | |
| 12/30/2019 12/30/19 | Rented | $3,000 | +3.4% | -- | |
| 12/25/2019 12/25/19 | Under Contract | -- | -- | -- | |
| 12/17/2019 12/17/19 | For Rent | $2,900 | 0.0% | -- | |
| 06/29/2019 06/29/19 | Rented | $2,900 | 0.0% | -- | |
| 06/22/2019 06/22/19 | For Rent | $2,900 | +1.8% | -- | |
| 06/11/2017 06/11/17 | Rented | $2,850 | 0.0% | -- | |
| 06/11/2017 06/11/17 | Under Contract | -- | -- | -- | |
| 06/05/2017 06/05/17 | For Rent | $2,850 | +3.6% | -- | |
| 06/29/2015 06/29/15 | Rented | $2,750 | 0.0% | -- | |
| 06/27/2015 06/27/15 | Under Contract | -- | -- | -- | |
| 04/15/2015 04/15/15 | For Rent | $2,750 | +3.8% | -- | |
| 05/10/2013 05/10/13 | Rented | $2,650 | -99.5% | -- | |
| 05/07/2013 05/07/13 | Under Contract | -- | -- | -- | |
| 04/15/2013 04/15/13 | Sold | $565,000 | 0.0% | $335 / Sq Ft | View Prior Sale |
| 04/15/2013 04/15/13 | For Rent | $2,650 | 0.0% | -- | |
| 03/17/2013 03/17/13 | Pending | -- | -- | -- | |
| 03/14/2013 03/14/13 | For Sale | $565,000 | -- | $335 / Sq Ft |
| Year | Tax Paid | Tax Assessment Tax Assessment Total Assessment is a certain percentage of the fair market value that is determined by local assessors to be the total taxable value of land and additions on the property. | Land | Improvement |
|---|---|---|---|---|
| 2025 | $7,187 | $636,350 | $127,000 | $509,350 |
| 2024 | $7,187 | $594,720 | $119,000 | $475,720 |
| 2023 | $6,490 | $550,670 | $110,000 | $440,670 |
| 2022 | $6,572 | $550,670 | $110,000 | $440,670 |
| 2021 | $6,417 | $524,450 | $105,000 | $419,450 |
| 2020 | $6,103 | $494,760 | $99,000 | $395,760 |
| 2019 | $5,498 | $445,730 | $86,000 | $359,730 |
| 2018 | $4,929 | $428,590 | $86,000 | $342,590 |
| 2017 | $5,516 | $455,460 | $91,000 | $364,460 |
| 2016 | $5,983 | $495,060 | $99,000 | $396,060 |
| 2015 | $6,011 | $515,560 | $103,000 | $412,560 |
| 2014 | $5,718 | $495,730 | $99,000 | $396,730 |
Landlord's Agent in 2020
Pia Castagnino
Samson Properties
(703) 989-0362
1 in this area
29 Total Sales
d
Tenant's Agent in 2020
datacorrect BrightMLS
Non Subscribing Office
Buyer's Agent in 2019
Wei Qu
Libra Realty, LLC
(703) 980-9800
3 in this area
77 Total Sales
Buyer's Agent in 2019
Hala Adra
Compass
(703) 980-4041
5 in this area
48 Total Sales
Buyer's Agent in 2017
Mass Farzan
Samson Properties
(703) 965-6900
1 in this area
20 Total Sales
Seller's Agent in 2015
Samia Gouda
Weichert Corporate
(301) 509-2270
6 in this area
16 Total Sales
Source: Bright MLS
MLS Number: VAFX1138086
APN: 0293-17040926
Disclaimer: Certain information contained herein is derived from information provided by parties other than Homes.com. All information provided is deemed reliable, but is not guaranteed to be accurate and should be independently verified.
![]() The data relating to real estate for sale on this website appears in part through the BRIGHT Internet Data Exchange program, a voluntary cooperative exchange of property listing data between licensed real estate brokerage firms, and is provided by BRIGHT through a licensing agreement.
The data relating to real estate for sale on this website appears in part through the BRIGHT Internet Data Exchange program, a voluntary cooperative exchange of property listing data between licensed real estate brokerage firms, and is provided by BRIGHT through a licensing agreement.
Listing information is from various brokers who participate in the Bright MLS IDX program and not all listings may be visible on the site.
The property information being provided on or through the website is for the personal, non-commercial use of consumers and such information may not be used for any purpose other than to identify prospective properties consumers may be interested in purchasing.
Some properties which appear for sale on the website may no longer be available because they are for instance, under contract, sold or are no longer being offered for sale.
Property information displayed is deemed reliable but is not guaranteed.
Copyright 2025 Bright MLS, Inc.