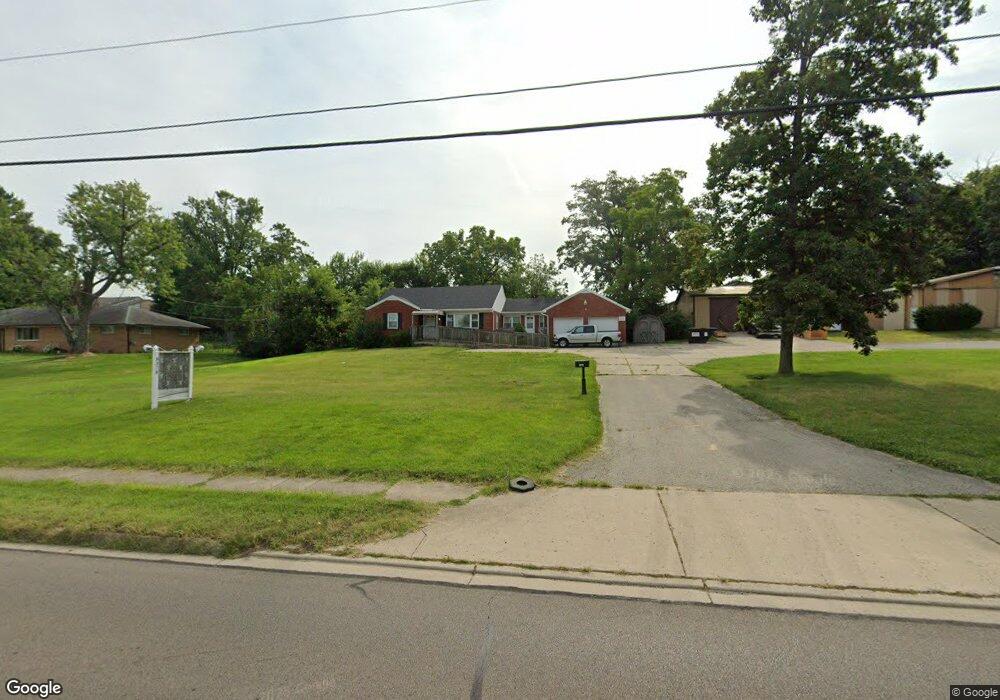
8378 Byers Rd Miamisburg, OH 45342
Estimated Value: $464,747
2
Beds
1
Bath
1,253
Sq Ft
$371/Sq Ft
Est. Value
About This Home
This home is located at 8378 Byers Rd, Miamisburg, OH 45342 and is currently estimated at $464,747, approximately $370 per square foot. 8378 Byers Rd is a home located in Montgomery County with nearby schools including Miamisburg High School, Bishop Leibold School, and Dayton Christian School.
Ownership History
Date
Name
Owned For
Owner Type
Purchase Details
Closed on
May 28, 2024
Sold by
Michaels Christine
Bought by
8378 Byers Rd Llc
Current Estimated Value
Home Financials for this Owner
Home Financials are based on the most recent Mortgage that was taken out on this home.
Original Mortgage
$296,000
Outstanding Balance
$290,287
Interest Rate
7.09%
Mortgage Type
Credit Line Revolving
Estimated Equity
$174,460
Purchase Details
Closed on
Nov 6, 2008
Sold by
Michaels Jerry W and Michaels Christine G
Bought by
J Michaels Inc
Purchase Details
Closed on
Jul 26, 2002
Sold by
Webb Charles D and Webb Susan J
Bought by
Michaels Jerry W and Michaels Christine G
Purchase Details
Closed on
Jun 26, 2000
Sold by
Webb Charles D and Webb Susan J
Bought by
Michaels Jerry W and Michaels Christine G
Home Financials for this Owner
Home Financials are based on the most recent Mortgage that was taken out on this home.
Original Mortgage
$200,000
Interest Rate
8.64%
Mortgage Type
Seller Take Back
Create a Home Valuation Report for This Property
The Home Valuation Report is an in-depth analysis detailing your home's value as well as a comparison with similar homes in the area
Home Values in the Area
Average Home Value in this Area
Purchase History
| Date | Buyer | Sale Price | Title Company |
|---|---|---|---|
| 8378 Byers Rd Llc | -- | None Listed On Document | |
| J Michaels Inc | -- | Attorney | |
| Michaels Jerry W | $240,000 | -- | |
| Michaels Jerry W | $200,000 | -- |
Source: Public Records
Mortgage History
| Date | Status | Borrower | Loan Amount |
|---|---|---|---|
| Open | 8378 Byers Rd Llc | $296,000 | |
| Previous Owner | Michaels Jerry W | $200,000 |
Source: Public Records
Tax History Compared to Growth
Tax History
| Year | Tax Paid | Tax Assessment Tax Assessment Total Assessment is a certain percentage of the fair market value that is determined by local assessors to be the total taxable value of land and additions on the property. | Land | Improvement |
|---|---|---|---|---|
| 2024 | $8,517 | $84,120 | $18,390 | $65,730 |
| 2023 | $8,517 | $84,120 | $18,390 | $65,730 |
| 2022 | $4,722 | $48,350 | $10,570 | $37,780 |
| 2021 | $4,478 | $48,350 | $10,570 | $37,780 |
| 2020 | $3,678 | $48,170 | $10,570 | $37,600 |
| 2019 | $2,882 | $34,130 | $10,570 | $23,560 |
| 2018 | $2,862 | $34,130 | $10,570 | $23,560 |
| 2017 | $2,845 | $34,130 | $10,570 | $23,560 |
| 2016 | $2,960 | $34,100 | $10,570 | $23,530 |
| 2015 | $2,910 | $34,100 | $10,570 | $23,530 |
| 2014 | $2,910 | $34,100 | $10,570 | $23,530 |
| 2012 | -- | $40,140 | $9,090 | $31,050 |
Source: Public Records
Map
Nearby Homes
- 628 Jamestown Dr
- 2279 Rosina Dr
- 712 Decker Dr
- 736 Decker Dr
- 2968 Asbury Ct
- 2141 Rosina Dr
- 1157 Bonniebrook Dr
- 3902 Augusta Rd
- 2127 Carrington Ln
- 9220 Sawgrass Dr
- 9228 Sawgrass Dr
- 1826 Ashley Dr
- 302 Trails Way Unit 27unb
- 2090 E Central Ave
- 1792 Cherokee Dr Unit A
- 1788 Cherokee Dr Unit F
- 3316 Vanquil Trail Unit 387
- 1 Pendle Point
- 1907 Falling Leaf Ln Unit 35801TH
- 1902 Whispering Tree Dr Unit B