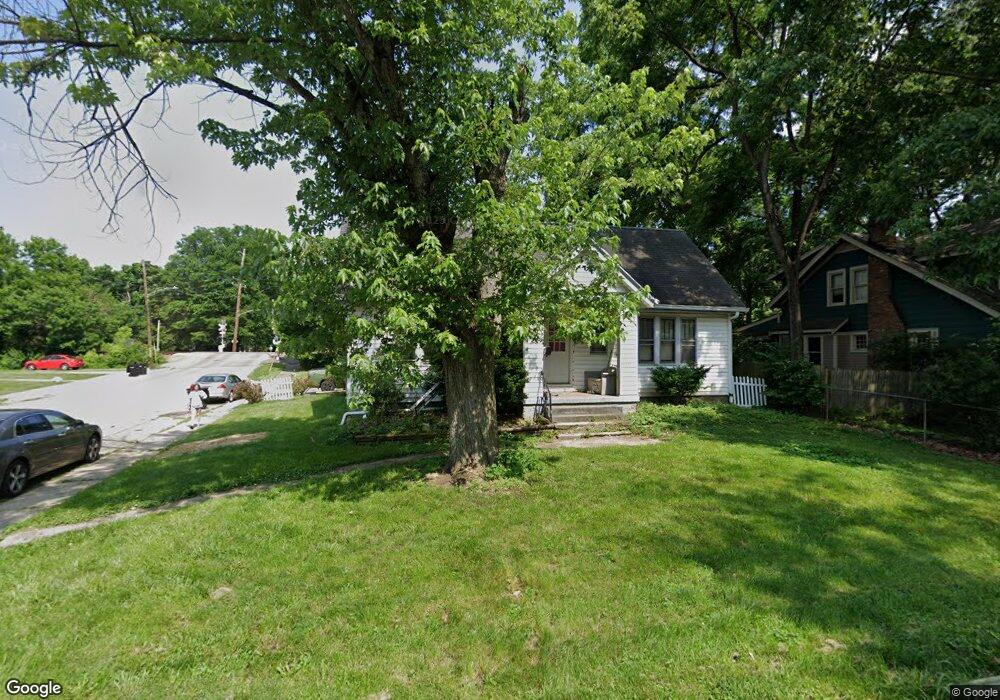
8378 Mace Ave Cincinnati, OH 45216
Hartwell NeighborhoodEstimated Value: $91,000 - $146,000
2
Beds
1
Bath
1,053
Sq Ft
$124/Sq Ft
Est. Value
About This Home
This home is located at 8378 Mace Ave, Cincinnati, OH 45216 and is currently estimated at $130,308, approximately $123 per square foot. 8378 Mace Ave is a home located in Hamilton County with nearby schools including Rising Stars at Carthage, Hartwell School, and Shroder High School.
Ownership History
Date
Name
Owned For
Owner Type
Purchase Details
Closed on
Nov 2, 2006
Sold by
Gmac Mortgage Llc
Bought by
Brindle John Edward and Brindle Sharon L
Current Estimated Value
Purchase Details
Closed on
Jun 1, 2006
Sold by
Jones Carlo E and Jones Marilyn R
Bought by
Gmac Mortgage Corp
Purchase Details
Closed on
May 7, 2005
Sold by
Jones Carlo E
Bought by
American Pension Services
Purchase Details
Closed on
Jan 18, 2005
Sold by
Jones Marilyn R
Bought by
American Pension Services
Purchase Details
Closed on
Jan 27, 1995
Sold by
Jasper Lela
Bought by
Jones Carlo E and Jones Marilyn R
Home Financials for this Owner
Home Financials are based on the most recent Mortgage that was taken out on this home.
Original Mortgage
$41,600
Interest Rate
9.26%
Create a Home Valuation Report for This Property
The Home Valuation Report is an in-depth analysis detailing your home's value as well as a comparison with similar homes in the area
Home Values in the Area
Average Home Value in this Area
Purchase History
| Date | Buyer | Sale Price | Title Company |
|---|---|---|---|
| Brindle John Edward | $44,000 | Sovereign Title Agency Llc | |
| Gmac Mortgage Corp | $49,500 | None Available | |
| American Pension Services | -- | None Available | |
| American Pension Services | -- | None Available | |
| Jones Carlo E | -- | -- |
Source: Public Records
Mortgage History
| Date | Status | Borrower | Loan Amount |
|---|---|---|---|
| Previous Owner | Jones Carlo E | $41,600 |
Source: Public Records
Tax History
| Year | Tax Paid | Tax Assessment Tax Assessment Total Assessment is a certain percentage of the fair market value that is determined by local assessors to be the total taxable value of land and additions on the property. | Land | Improvement |
|---|---|---|---|---|
| 2025 | $2,012 | $30,724 | $8,047 | $22,677 |
| 2023 | $2,012 | $30,724 | $8,047 | $22,677 |
| 2022 | $1,485 | $20,150 | $7,581 | $12,569 |
| 2021 | $1,440 | $20,150 | $7,581 | $12,569 |
| 2020 | $1,444 | $20,150 | $7,581 | $12,569 |
| 2019 | $1,468 | $18,659 | $7,021 | $11,638 |
| 2018 | $1,469 | $18,659 | $7,021 | $11,638 |
| 2017 | $1,413 | $18,659 | $7,021 | $11,638 |
| 2016 | $1,449 | $18,676 | $7,021 | $11,655 |
| 2015 | $1,299 | $18,676 | $7,021 | $11,655 |
| 2014 | $1,306 | $18,676 | $7,021 | $11,655 |
| 2013 | $1,393 | $19,660 | $7,392 | $12,268 |
Source: Public Records
Map
Nearby Homes
- 8421 Wiswell St
- 42 Sheehan Ave
- 8338 Anthony Wayne Ave
- 342 Durrell Ave
- 8318 Marley St
- 25 Euclid Ave
- 29 Hartwell Ct
- 177 Burns Ave
- 241 Oakmont St
- 529 Elliott Ave
- 8415 Mayfair St
- 8081 Woodbine Ave
- 7871 Glenorchard Dr
- 7831 Glen Orchard Dr
- 163 Compton Rd
- 701 W Wyoming Ave
- 334 Williams St
- 7829 Sunfield Dr
- 127 Locust St
- 1808 Crest Hill Ave
- 8375 Woodbine Ave
- 132 Sheehan Ave
- 8373 Woodbine Ave
- 128 Sheehan Ave
- 8377 Mace Ave
- 8371 Woodbine Ave
- 8372 Mace Ave
- 8372 Mace Ave
- 8373 Mace Ave
- 124 Sheehan Ave
- 8367 Woodbine Ave
- 8369 Mace Ave
- 120 Sheehan Ave
- 140 Sheehan Ave
- 8365 Mace Ave
- 116 Sheehan Ave
- 8361 Mace Ave
- 8359 Woodbine Ave
- 8355 Woodbine Ave
- 8378 Burns Ave
Your Personal Tour Guide
Ask me questions while you tour the home.