
Seller's Agent in 2025
Molly Bjork
Keller Williams Realty GDM
(515) 216-3839
1 in this area
76 Total Sales


Estimated Value: $244,000 - $284,083
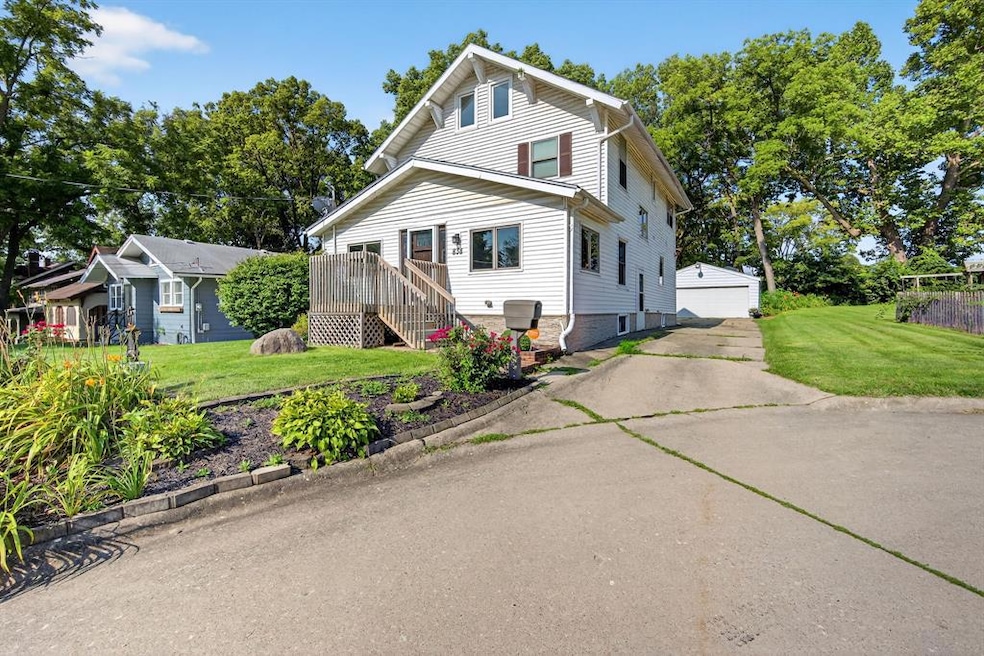
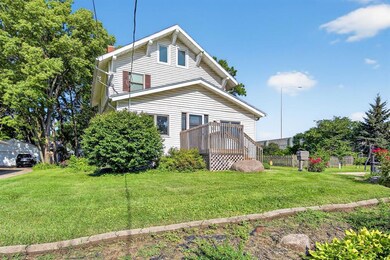
Originally built in 1900, this stunning home has been thoughtfully rebuilt from the studs up, preserving the beautiful original woodwork while adding the modern conveniences today’s buyers expect. Tucked away on a dead-end road and situated on a spacious double lot, this property offers both privacy and room to grow.
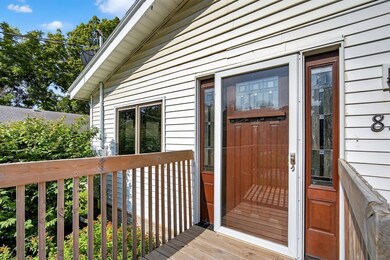
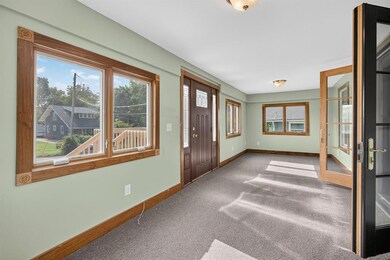
Step inside the enclosed front porch and through charming double doors into the warm and inviting living room and formal dining area—perfect for entertaining. The generously sized kitchen offers ample cabinetry, a convenient drop zone/laundry area, and plenty of storage throughout.
Upstairs, you’ll find three spacious bedrooms plus a fourth non-conforming room that makes a perfect office or playroom. The finished attic, complete with an egress window, offers even more flexible space—ideal for a guest room, hobby area, or additional bedroom.
Top-to-bottom upgrades include triple-paned, extra-insulated Pella windows and doors, a new roof in 2023, and a water heater installed in 2022. All appliances stay for your convenience—just move in and enjoy.
Don’t miss the chance to own this rare gem blending classic craftsmanship with modern updates on a peaceful, oversized lot!
| Date | Buyer | Sale Price | Title Company |
|---|---|---|---|
| Martinez Rene | $250,000 | None Listed On Document | |
| Wadie Beverly A | -- | None Available | |
| Wadle Barry C | -- | Attorney | |
| Wadle Barry C | -- | None Available | |
| Wadle Barry C | $56,500 | None Available |
| Date | Status | Borrower | Loan Amount |
|---|---|---|---|
| Open | Martinez Rene | $230,000 | |
| Previous Owner | Wadle Barry C | $122,400 | |
| Previous Owner | Wadle Barry C | $115,886 |
| Date | Event | Price | List to Sale | Price per Sq Ft |
|---|---|---|---|---|
| 12/08/2025 12/08/25 | Sold | $250,000 | -7.4% | $123 / Sq Ft |
| 11/09/2025 11/09/25 | Pending | -- | -- | -- |
| 11/07/2025 11/07/25 | Price Changed | $269,900 | -3.6% | $132 / Sq Ft |
| 09/15/2025 09/15/25 | Price Changed | $279,900 | -3.5% | $137 / Sq Ft |
| 08/02/2025 08/02/25 | For Sale | $290,000 | -- | $142 / Sq Ft |
| Year | Tax Paid | Tax Assessment Tax Assessment Total Assessment is a certain percentage of the fair market value that is determined by local assessors to be the total taxable value of land and additions on the property. | Land | Improvement |
|---|---|---|---|---|
| 2025 | $3,320 | $293,900 | $52,600 | $241,300 |
| 2024 | $3,320 | $280,700 | $50,100 | $230,600 |
| 2023 | $2,824 | $280,700 | $50,100 | $230,600 |
| 2022 | $2,800 | $223,200 | $41,500 | $181,700 |
| 2021 | $2,404 | $223,200 | $41,500 | $181,700 |
| 2020 | $2,492 | $199,400 | $37,300 | $162,100 |
| 2019 | $2,080 | $199,400 | $37,300 | $162,100 |
| 2018 | $2,054 | $180,400 | $33,300 | $147,100 |
| 2017 | $1,614 | $180,400 | $33,300 | $147,100 |
| 2016 | $1,568 | $162,700 | $29,900 | $132,800 |
| 2015 | $1,568 | $162,700 | $29,900 | $132,800 |
| 2014 | $1,564 | $153,400 | $28,000 | $125,400 |
Seller's Agent in 2025
Molly Bjork
Keller Williams Realty GDM
(515) 216-3839
1 in this area
76 Total Sales
Buyer's Agent in 2025
Beatris Mayorga
RE/MAX
(515) 612-2702
3 in this area
383 Total Sales
Source: Des Moines Area Association of REALTORS®
MLS Number: 723548
APN: 090-03580002000
Disclaimer: Certain information contained herein is derived from information provided by parties other than Homes.com. All information provided is deemed reliable, but is not guaranteed to be accurate and should be independently verified.
![]() IDX information is provided exclusively for personal, non-commercial use, and may not be used for any purpose other than to identify prospective properties consumers may be interested in purchasing. Information is deemed reliable but not guaranteed.
IDX information is provided exclusively for personal, non-commercial use, and may not be used for any purpose other than to identify prospective properties consumers may be interested in purchasing. Information is deemed reliable but not guaranteed.
Ask me questions while you tour the home.