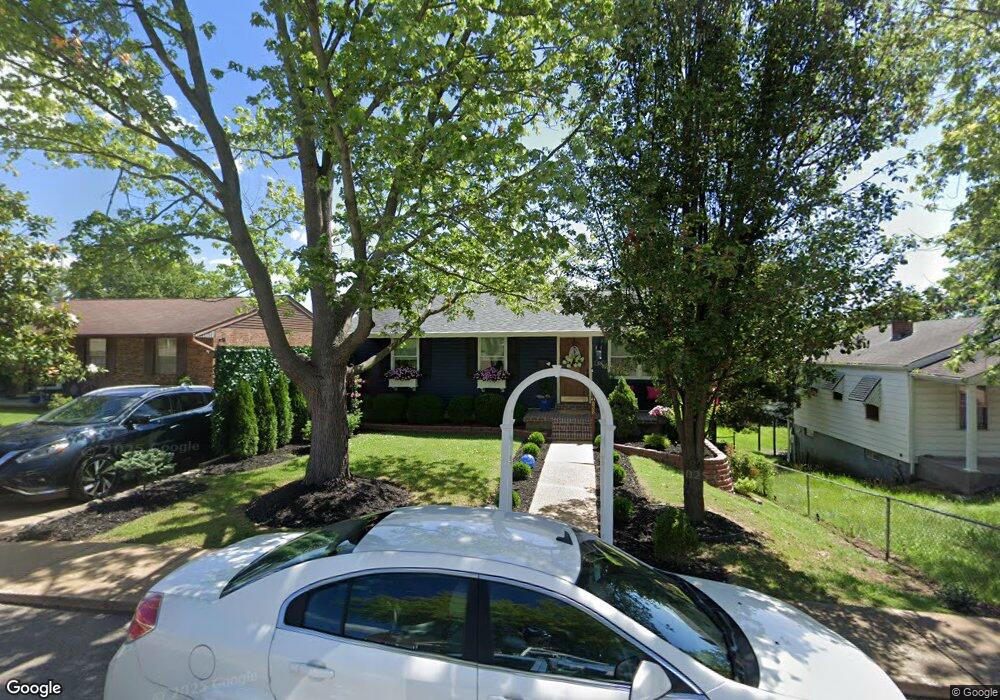
838 Ann St Festus, MO 63028
Festus/Crystal City NeighborhoodEstimated Value: $199,000 - $228,000
Studio
--
Bath
1,220
Sq Ft
$176/Sq Ft
Est. Value
About This Home
This home is located at 838 Ann St, Festus, MO 63028 and is currently estimated at $214,389, approximately $175 per square foot. 838 Ann St is a home located in Jefferson County with nearby schools including Festus Elementary School, Festus Intermediate School, and Festus Middle School.
Ownership History
Date
Name
Owned For
Owner Type
Purchase Details
Closed on
Jun 27, 2003
Sold by
Jones Thomas E and Jones Sharon J
Bought by
Reynolds Rae
Current Estimated Value
Home Financials for this Owner
Home Financials are based on the most recent Mortgage that was taken out on this home.
Original Mortgage
$104,452
Outstanding Balance
$44,058
Interest Rate
5.27%
Mortgage Type
Purchase Money Mortgage
Estimated Equity
$170,331
Purchase Details
Closed on
Feb 25, 1999
Sold by
Neal Richard E and Neal Kathleen A
Bought by
Jones Thomas E and Jones Sharon J
Home Financials for this Owner
Home Financials are based on the most recent Mortgage that was taken out on this home.
Original Mortgage
$80,580
Interest Rate
6.83%
Mortgage Type
VA
Create a Home Valuation Report for This Property
The Home Valuation Report is an in-depth analysis detailing your home's value as well as a comparison with similar homes in the area
Home Values in the Area
Average Home Value in this Area
Purchase History
| Date | Buyer | Sale Price | Title Company |
|---|---|---|---|
| Reynolds Rae | -- | -- | |
| Jones Thomas E | -- | Hillsboro Title Company Inc |
Source: Public Records
Mortgage History
| Date | Status | Borrower | Loan Amount |
|---|---|---|---|
| Open | Reynolds Rae | $104,452 | |
| Previous Owner | Jones Thomas E | $80,580 |
Source: Public Records
Tax History
| Year | Tax Paid | Tax Assessment Tax Assessment Total Assessment is a certain percentage of the fair market value that is determined by local assessors to be the total taxable value of land and additions on the property. | Land | Improvement |
|---|---|---|---|---|
| 2025 | $889 | $17,100 | $1,500 | $15,600 |
| 2024 | $889 | $15,700 | $1,500 | $14,200 |
| 2023 | $889 | $15,700 | $1,500 | $14,200 |
| 2022 | $884 | $15,700 | $1,500 | $14,200 |
| 2021 | $885 | $15,700 | $1,500 | $14,200 |
| 2020 | $860 | $14,300 | $1,200 | $13,100 |
| 2019 | $859 | $14,300 | $1,200 | $13,100 |
| 2018 | $775 | $14,300 | $1,200 | $13,100 |
| 2016 | $703 | $12,900 | $1,300 | $11,600 |
Source: Public Records
Map
Nearby Homes
- 115 N 9th St
- 601 Warne St
- 617 N 6th St
- 725 Woodrow Ave
- 416 Russell Ave
- 807 Huber St
- 1824 Oak Dr
- 122 Northview Dr
- 912 Parc Central Dr
- 328 N 2nd St
- 1648 Flagstaff Dr
- 105 Ozark Dr
- 309 Jefferson Ave
- 119 Riverport Dr
- 209 Virginia Ave
- 422 Harry Truman Ct
- 403 Harry Truman Ct
- 113 Parkview Dr
- 219 Jefferson Ave
- 114 Doctrine Dr
Your Personal Tour Guide
Ask me questions while you tour the home.