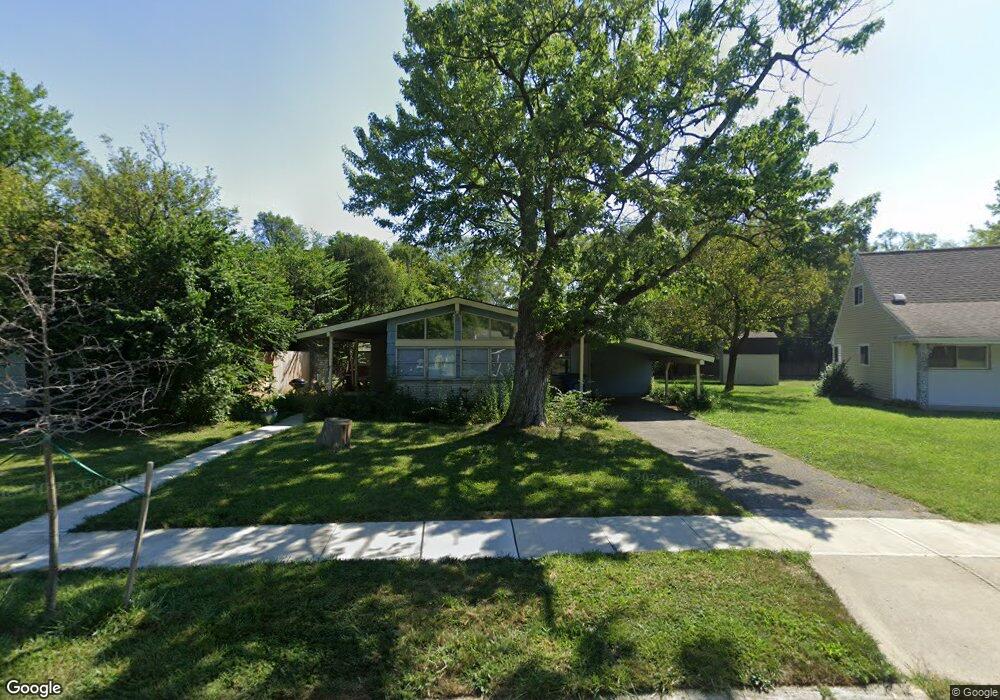
838 Bricker Blvd Columbus, OH 43221
Cranbrook NeighborhoodEstimated Value: $236,000 - $347,000
3
Beds
1
Bath
1,077
Sq Ft
$269/Sq Ft
Est. Value
About This Home
This home is located at 838 Bricker Blvd, Columbus, OH 43221 and is currently estimated at $290,175, approximately $269 per square foot. 838 Bricker Blvd is a home located in Franklin County with nearby schools including Cranbrook Elementary School, Ridgeview Middle School, and Centennial High School.
Ownership History
Date
Name
Owned For
Owner Type
Purchase Details
Closed on
Mar 23, 2012
Sold by
Eaglin Brian C and Eaglin Courtney
Bought by
Brown Nathan M
Current Estimated Value
Home Financials for this Owner
Home Financials are based on the most recent Mortgage that was taken out on this home.
Original Mortgage
$86,250
Outstanding Balance
$8,659
Interest Rate
3.9%
Mortgage Type
New Conventional
Estimated Equity
$281,516
Purchase Details
Closed on
Mar 14, 2003
Sold by
Smith George W and Smith Debra Lynn
Bought by
Eaglin Brian C and Brown Nathan
Purchase Details
Closed on
Aug 9, 1974
Bought by
Smith George W
Create a Home Valuation Report for This Property
The Home Valuation Report is an in-depth analysis detailing your home's value as well as a comparison with similar homes in the area
Home Values in the Area
Average Home Value in this Area
Purchase History
We collect this data history from publicly available records. To have your information removed, we recommend requesting removal directly through your county’s website.
| Date | Buyer | Sale Price | Title Company |
|---|---|---|---|
| Brown Nathan M | $62,700 | Mepapex | |
| Eaglin Brian C | $108,000 | Real Living Title | |
| Smith George W | -- | -- |
Source: Public Records
Mortgage History
We collect this data history from publicly available records. To have your information removed, we recommend requesting removal directly through your county’s website.
| Date | Status | Borrower | Loan Amount |
|---|---|---|---|
| Open | Brown Nathan M | $86,250 |
Source: Public Records
Tax History
| Year | Tax Paid | Tax Assessment Tax Assessment Total Assessment is a certain percentage of the fair market value that is determined by local assessors to be the total taxable value of land and additions on the property. | Land | Improvement |
|---|---|---|---|---|
| 2025 | $3,800 | $82,920 | $48,160 | $34,760 |
| 2024 | $3,800 | $82,920 | $48,160 | $34,760 |
| 2023 | $3,753 | $82,920 | $48,160 | $34,760 |
| 2022 | $3,198 | $60,170 | $25,620 | $34,550 |
| 2021 | $3,203 | $60,170 | $25,620 | $34,550 |
| 2020 | $3,208 | $60,170 | $25,620 | $34,550 |
| 2019 | $2,971 | $47,780 | $25,620 | $22,160 |
| 2018 | $2,875 | $46,690 | $25,620 | $21,070 |
| 2017 | $2,903 | $46,690 | $25,620 | $21,070 |
| 2016 | $3,132 | $46,100 | $20,340 | $25,760 |
| 2015 | $2,851 | $46,100 | $20,340 | $25,760 |
| 2014 | $2,858 | $46,100 | $20,340 | $25,760 |
| 2013 | $1,343 | $43,890 | $19,355 | $24,535 |
Source: Public Records
Map
Nearby Homes
- 922 Chatham Ln Unit B
- 880 Faculty Dr
- 957 Varsity Ave
- 1008 Manor Ln Unit E
- 3082 Trentwood Rd
- 1068 Shady Hill Dr
- 3309 Mansion Way Unit 7
- 2869 N Star Rd
- 999 Brentford Dr
- 1491 Kirkley Rd
- 785 Island Ct
- 3517 La Rochelle Dr Unit B21U
- 1470 London Dr
- 3027 Sunset Dr Unit 3027
- 191 Brighton Rd
- 139 W Como Ave Unit 141
- 288 W Orchard Ln
- 110 W Tulane Rd
- 94 W Tulane Rd
- 81 W Lakeview Ave
- 801 Bricker Blvd
- 815 Bricker Blvd
- 3040 Rightmire Blvd
- 849 Bricker Blvd
- 829 Bricker Blvd
- 841 Bricker Blvd
- 806 Bricker Blvd
- 3042 Rightmire Blvd
- 851 Bricker Blvd
- 3031 Rightmire Blvd
- 881 Varsity Ave
- 3044 Rightmire Blvd
- 836 Bricker Blvd
- 3033 Rightmire Blvd
- 3035 Rightmire Blvd
- 840 Bricker Blvd
- 840 Bricker Blvd
- 3037 Rightmire Blvd
- 891 Varsity Ave
- 3046 Rightmire Blvd
Your Personal Tour Guide
Ask me questions while you tour the home.