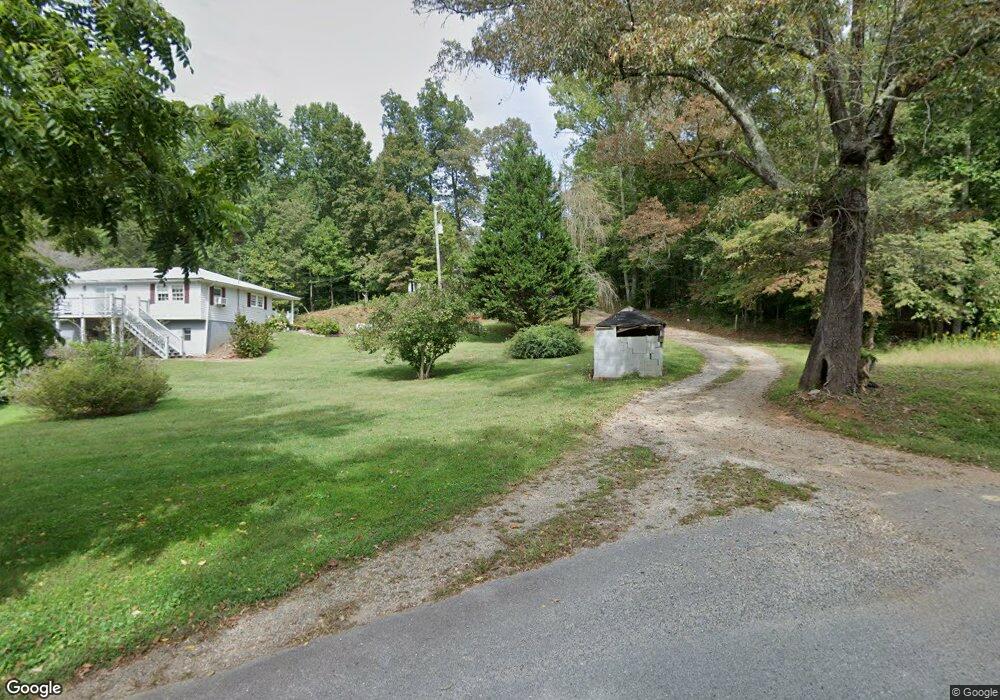
838 Cain Bridge Rd Dahlonega, GA 30533
Estimated Value: $335,000 - $533,000
--
Bed
2
Baths
2,066
Sq Ft
$203/Sq Ft
Est. Value
About This Home
This home is located at 838 Cain Bridge Rd, Dahlonega, GA 30533 and is currently estimated at $419,444, approximately $203 per square foot. 838 Cain Bridge Rd is a home located in Lumpkin County with nearby schools including Lumpkin County High School.
Ownership History
Date
Name
Owned For
Owner Type
Purchase Details
Closed on
Mar 7, 2006
Sold by
Not Provided
Bought by
Regan Kevin Thomas
Current Estimated Value
Home Financials for this Owner
Home Financials are based on the most recent Mortgage that was taken out on this home.
Original Mortgage
$150,500
Outstanding Balance
$84,452
Interest Rate
6.05%
Mortgage Type
New Conventional
Estimated Equity
$334,992
Purchase Details
Closed on
Feb 24, 2006
Sold by
Not Provided
Bought by
Thompson Fred C
Home Financials for this Owner
Home Financials are based on the most recent Mortgage that was taken out on this home.
Original Mortgage
$150,500
Outstanding Balance
$84,452
Interest Rate
6.05%
Mortgage Type
New Conventional
Estimated Equity
$334,992
Purchase Details
Closed on
Nov 26, 2003
Sold by
Armstrong Melvin C Etal
Bought by
Thompson Eloise
Purchase Details
Closed on
Nov 4, 2003
Sold by
Thompson Eloise
Bought by
Thompson Eloiseand Fred
Purchase Details
Closed on
Feb 1, 1985
Bought by
Thompson Eloise
Create a Home Valuation Report for This Property
The Home Valuation Report is an in-depth analysis detailing your home's value as well as a comparison with similar homes in the area
Home Values in the Area
Average Home Value in this Area
Purchase History
| Date | Buyer | Sale Price | Title Company |
|---|---|---|---|
| Regan Kevin Thomas | $35,000 | -- | |
| Thompson Fred C | -- | -- | |
| Thompson Eloise | -- | -- | |
| Thompson Eloiseand Fred | -- | -- | |
| Thompson Eloise | -- | -- |
Source: Public Records
Mortgage History
| Date | Status | Borrower | Loan Amount |
|---|---|---|---|
| Open | Thompson Fred C | $150,500 |
Source: Public Records
Tax History Compared to Growth
Tax History
| Year | Tax Paid | Tax Assessment Tax Assessment Total Assessment is a certain percentage of the fair market value that is determined by local assessors to be the total taxable value of land and additions on the property. | Land | Improvement |
|---|---|---|---|---|
| 2024 | $3,069 | $134,709 | $9,296 | $125,413 |
| 2023 | $2,519 | $126,640 | $9,296 | $117,344 |
| 2022 | $2,824 | $116,064 | $9,296 | $106,768 |
| 2021 | $2,391 | $95,415 | $5,810 | $89,605 |
| 2020 | $2,401 | $93,032 | $5,810 | $87,222 |
| 2019 | $2,423 | $93,032 | $5,810 | $87,222 |
| 2018 | $2,277 | $82,263 | $5,810 | $76,453 |
| 2017 | $2,196 | $77,924 | $5,810 | $72,114 |
| 2016 | $2,092 | $71,966 | $5,810 | $66,156 |
| 2015 | $1,864 | $71,966 | $5,810 | $66,156 |
| 2014 | $1,864 | $72,693 | $5,810 | $66,883 |
| 2013 | -- | $73,420 | $5,810 | $67,610 |
Source: Public Records
Map
Nearby Homes
- 307 Eagle Overlook Dr
- 328 Jennifer Ct
- 334 Silas Rd
- 0 Eagle Rest Rd Unit 13519388
- 70 Deerwood Cir
- 55 Flat Rock Pointe
- 0 Charlie Lemley Rd Unit 7693340
- 0 Charlie Lemley Rd Unit 10658696
- 7-/+ Charlie Lemley Rd
- 1405 Burnt Stand Rd
- TRACT1 Panorama Dr
- 1 Grey Swan Way
- 5195 S Chestatee
- 201 Whelchel Valley Dr
- 0 Long Branch Rd Unit 10271720
- 0 Long Branch Rd Unit 10271266
- 0 Long Branch Rd Unit 7357871
- 00 Long Branch Rd
- 35 Kitchen Way W
- 433 Elliots Ln
- 848 Cain Bridge Rd
- 72 NE Shelton Rd
- 72 Shelton Rd
- 171 Fairview Rd
- 0 Highway 400 and Cain Bridge Unit 3273651
- 869 Cain Bridge Rd
- 885 Cain Bridge Rd
- 17 Lester Shelton Rd
- 191 Lester Shelton Rd
- 0 Lester Shelton Rd
- 0 Lester Shelton Rd Unit 20097850
- 0 Lester Shelton Rd Unit 7163143
- 0 Lester Shelton Rd Unit 7340413
- 0 Lester Shelton Rd Unit 8083738
- 0 Lester Shelton Rd Unit 8099411
- 0 Lester Shelton Rd Unit 8358585
- 164 Lester Shelton Rd
- 124 Lester Shelton Rd
- 193 Lester Shelton Rd
- 50 Lester Shelton Rd