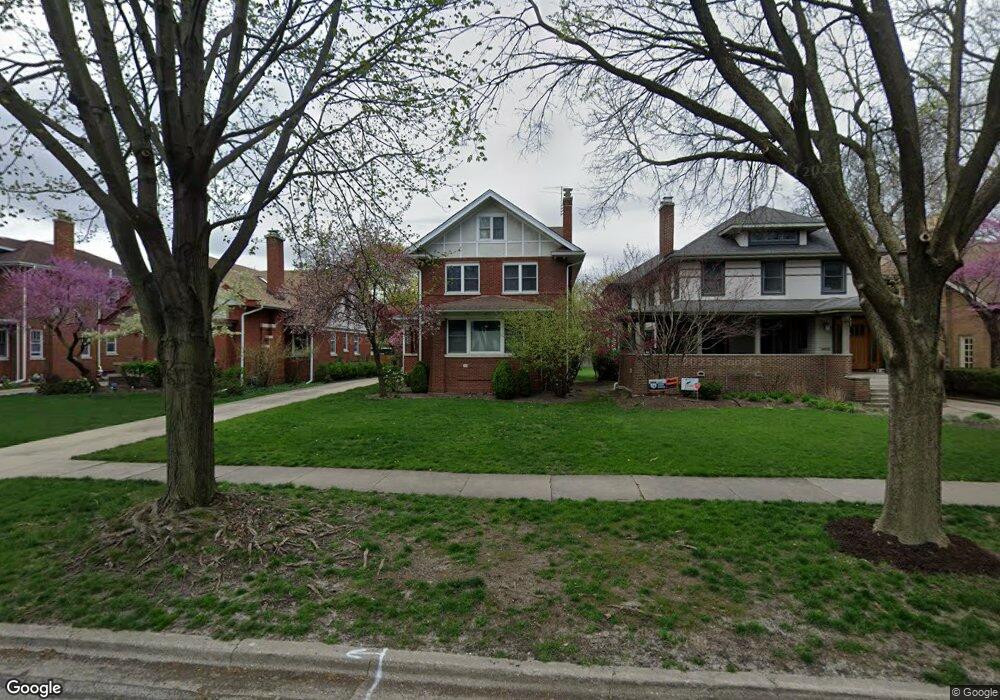
838 Clinton Place River Forest, IL 60305
Estimated Value: $707,000 - $1,019,000
4
Beds
3
Baths
2,278
Sq Ft
$404/Sq Ft
Est. Value
About This Home
This home is located at 838 Clinton Place, River Forest, IL 60305 and is currently estimated at $919,683, approximately $403 per square foot. 838 Clinton Place is a home located in Cook County with nearby schools including Willard Elementary School, Roosevelt Middle School, and Oak Park and River Forest High School.
Ownership History
Date
Name
Owned For
Owner Type
Purchase Details
Closed on
Apr 1, 2015
Sold by
Flanagan James
Bought by
Flangan Janes
Current Estimated Value
Purchase Details
Closed on
Jun 28, 2012
Sold by
Porter Matthew
Bought by
Flanagan James and Flanagan Jane
Purchase Details
Closed on
Nov 13, 2007
Sold by
Flanagan James and Flanagan Jane
Bought by
Porter Matthew and Grove Trust
Purchase Details
Closed on
Nov 15, 2005
Sold by
Demaria Josephine G
Bought by
Flanagan James L and Flanagan Jane P
Home Financials for this Owner
Home Financials are based on the most recent Mortgage that was taken out on this home.
Original Mortgage
$350,400
Interest Rate
6.17%
Mortgage Type
Fannie Mae Freddie Mac
Purchase Details
Closed on
Sep 15, 2003
Sold by
Howie James E and Howie Mary Ann
Bought by
Demaria Josephine G
Create a Home Valuation Report for This Property
The Home Valuation Report is an in-depth analysis detailing your home's value as well as a comparison with similar homes in the area
Home Values in the Area
Average Home Value in this Area
Purchase History
| Date | Buyer | Sale Price | Title Company |
|---|---|---|---|
| Flangan Janes | -- | Attorney | |
| Flanagan James | -- | None Available | |
| Porter Matthew | -- | None Available | |
| Flanagan James L | $730,000 | Prairie Title | |
| Demaria Josephine G | $620,000 | Multiple |
Source: Public Records
Mortgage History
| Date | Status | Borrower | Loan Amount |
|---|---|---|---|
| Previous Owner | Flanagan James L | $350,400 |
Source: Public Records
Tax History
| Year | Tax Paid | Tax Assessment Tax Assessment Total Assessment is a certain percentage of the fair market value that is determined by local assessors to be the total taxable value of land and additions on the property. | Land | Improvement |
|---|---|---|---|---|
| 2025 | $19,074 | $69,733 | $11,280 | $58,453 |
| 2024 | $19,074 | $69,733 | $11,280 | $58,453 |
| 2023 | $15,640 | $81,000 | $11,280 | $69,720 |
| 2022 | $15,640 | $51,854 | $9,870 | $41,984 |
| 2021 | $15,700 | $53,813 | $9,870 | $43,943 |
| 2020 | $15,936 | $55,544 | $9,870 | $45,674 |
| 2019 | $14,932 | $51,529 | $8,930 | $42,599 |
| 2018 | $15,018 | $54,536 | $8,930 | $45,606 |
| 2017 | $16,170 | $58,596 | $8,930 | $49,666 |
| 2016 | $15,400 | $50,369 | $7,520 | $42,849 |
| 2015 | $15,089 | $50,369 | $7,520 | $42,849 |
| 2014 | $14,754 | $53,536 | $7,520 | $46,016 |
| 2013 | $13,062 | $48,923 | $9,400 | $39,523 |
Source: Public Records
Map
Nearby Homes
- 940 Bonnie Brae Place
- 734 Bonnie Brae Place
- 710 William St
- 7210 Oak Ave Unit 4SW
- 7200 Oak Ave Unit 3NW
- 1010 N Harlem Ave Unit 503
- 711 Jackson Ave
- 425 N Maple Ave
- 7204 Oak Ave Unit 1NW
- 1101 Bonnie Brae Place
- 420 N Marion St
- 300 N Maple Ave
- 1125 Erie St
- 1146 Ontario St Unit 1E
- 1038 Superior St Unit 1W
- 742 N Marion St
- 227 N Marion St
- 222 N Marion St Unit 2J
- 510 Bonnie Brae Place Unit K3
- 7346 Lake St Unit GW
- 834 Clinton Place
- 842 Clinton Place
- 846 Clinton Place
- 830 Clinton Place
- 839 William St
- 826 Clinton Place
- 843 William St
- 822 Clinton Place
- 847 William St
- 827 William St
- 827 William St
- 835 William St
- 900 Clinton Place
- 818 Clinton Place
- 841 Clinton Place
- 837 Clinton Place
- 833 Clinton Place
- 847 Clinton Place
- 823 William St
- 908 Clinton Place
Your Personal Tour Guide
Ask me questions while you tour the home.