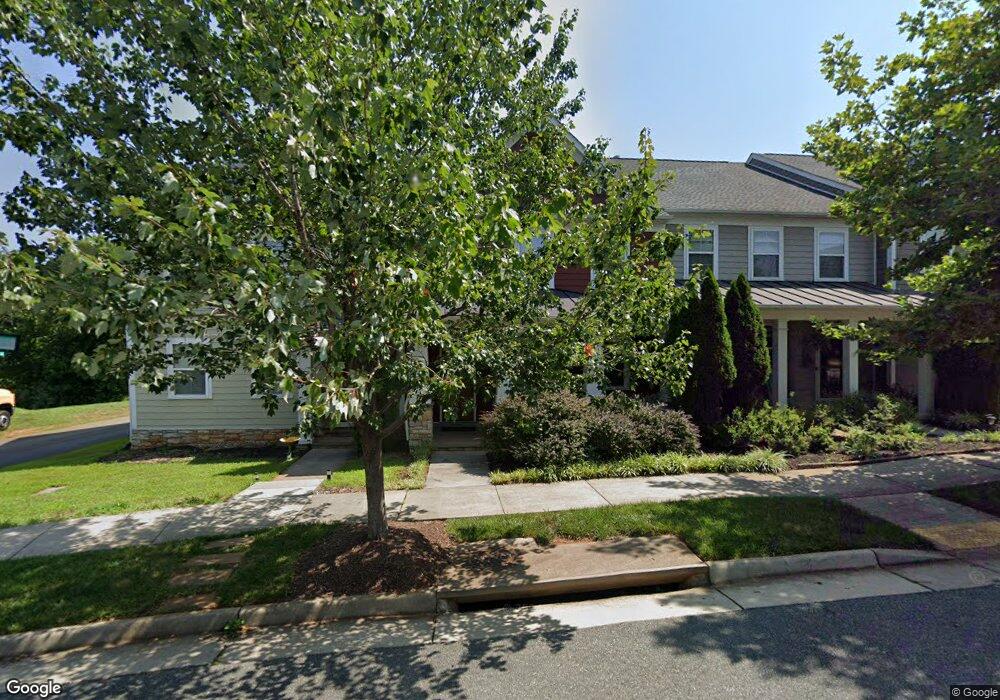
838 Cole St Charlottesville, VA 22901
Dunlora NeighborhoodEstimated Value: $536,199 - $594,000
3
Beds
3
Baths
2,192
Sq Ft
$256/Sq Ft
Est. Value
About This Home
This home is located at 838 Cole St, Charlottesville, VA 22901 and is currently estimated at $562,050, approximately $256 per square foot. 838 Cole St is a home located in Albemarle County with nearby schools including Agnor Elementary School, Jackson P. Burley Middle School, and Albemarle High School.
Ownership History
Date
Name
Owned For
Owner Type
Purchase Details
Closed on
Sep 27, 2017
Sold by
Gordon Scott A and Gordon Patricia S
Bought by
Gordon Patricia S and Patricia S Gordon Revocable Tr
Current Estimated Value
Purchase Details
Closed on
Jun 7, 2010
Sold by
Hauser Homes Llc
Bought by
Gordon Scott A and Gordon Patricia S
Home Financials for this Owner
Home Financials are based on the most recent Mortgage that was taken out on this home.
Original Mortgage
$180,000
Outstanding Balance
$120,043
Interest Rate
4.87%
Mortgage Type
New Conventional
Estimated Equity
$442,007
Create a Home Valuation Report for This Property
The Home Valuation Report is an in-depth analysis detailing your home's value as well as a comparison with similar homes in the area
Home Values in the Area
Average Home Value in this Area
Purchase History
| Date | Buyer | Sale Price | Title Company |
|---|---|---|---|
| Gordon Patricia S | -- | None Available | |
| Gordon Scott A | $305,908 | -- |
Source: Public Records
Mortgage History
| Date | Status | Borrower | Loan Amount |
|---|---|---|---|
| Open | Gordon Scott A | $180,000 |
Source: Public Records
Tax History Compared to Growth
Tax History
| Year | Tax Paid | Tax Assessment Tax Assessment Total Assessment is a certain percentage of the fair market value that is determined by local assessors to be the total taxable value of land and additions on the property. | Land | Improvement |
|---|---|---|---|---|
| 2025 | $4,791 | $535,900 | $135,000 | $400,900 |
| 2024 | $4,545 | $532,200 | $135,000 | $397,200 |
| 2023 | $4,403 | $515,600 | $126,000 | $389,600 |
| 2022 | $3,699 | $433,100 | $105,000 | $328,100 |
| 2021 | $3,217 | $376,700 | $100,000 | $276,700 |
| 2020 | $3,086 | $361,300 | $100,000 | $261,300 |
| 2019 | $3,353 | $392,600 | $100,000 | $292,600 |
| 2018 | $2,886 | $361,100 | $90,000 | $271,100 |
| 2017 | $2,742 | $326,800 | $65,000 | $261,800 |
| 2016 | $2,610 | $311,100 | $70,000 | $241,100 |
| 2015 | $2,510 | $306,500 | $70,000 | $236,500 |
| 2014 | -- | $304,300 | $70,000 | $234,300 |
Source: Public Records
Map
Nearby Homes