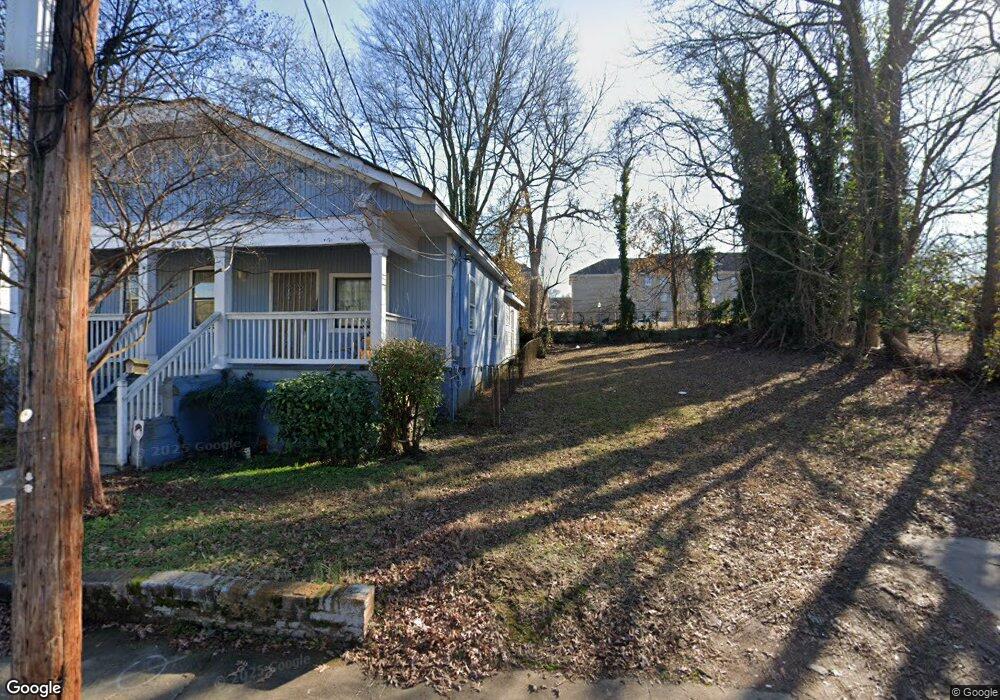
838 Drummond St SW Atlanta, GA 30314
University Center NeighborhoodEstimated Value: $84,586 - $275,000
2
Beds
1
Bath
1,032
Sq Ft
$144/Sq Ft
Est. Value
About This Home
This home is located at 838 Drummond St SW, Atlanta, GA 30314 and is currently estimated at $148,897, approximately $144 per square foot. 838 Drummond St SW is a home located in Fulton County with nearby schools including M. A. Jones Elementary School, Herman J. Russell West End Academy, and Booker T. Washington High School.
Ownership History
Date
Name
Owned For
Owner Type
Purchase Details
Closed on
Dec 1, 2011
Sold by
Campbell Kevin
Bought by
Morehouse College
Current Estimated Value
Purchase Details
Closed on
May 21, 2007
Sold by
Atlanta Investing Inc
Bought by
Pavilack Industries Inc
Home Financials for this Owner
Home Financials are based on the most recent Mortgage that was taken out on this home.
Original Mortgage
$110,000
Interest Rate
6.12%
Purchase Details
Closed on
Jan 17, 2007
Sold by
Aurora Loan Services Llc
Bought by
Atlanta Investing Inc
Home Financials for this Owner
Home Financials are based on the most recent Mortgage that was taken out on this home.
Original Mortgage
$38,250
Interest Rate
6.08%
Purchase Details
Closed on
Dec 5, 2006
Sold by
Tenpow Ivan G
Bought by
Aurora Loan Services Llc
Home Financials for this Owner
Home Financials are based on the most recent Mortgage that was taken out on this home.
Original Mortgage
$38,250
Interest Rate
6.08%
Purchase Details
Closed on
Jun 22, 2005
Sold by
Henry Wendel
Bought by
Tenpow Ivan G
Home Financials for this Owner
Home Financials are based on the most recent Mortgage that was taken out on this home.
Original Mortgage
$202,500
Interest Rate
5.54%
Mortgage Type
New Conventional
Purchase Details
Closed on
May 22, 2005
Sold by
Henry Wendel
Bought by
Tenpow Ivan G
Home Financials for this Owner
Home Financials are based on the most recent Mortgage that was taken out on this home.
Original Mortgage
$202,500
Interest Rate
5.54%
Mortgage Type
New Conventional
Purchase Details
Closed on
Feb 22, 2005
Sold by
Henry Wendel
Bought by
Tenpow Ivan G
Home Financials for this Owner
Home Financials are based on the most recent Mortgage that was taken out on this home.
Original Mortgage
$202,500
Interest Rate
5.68%
Mortgage Type
New Conventional
Purchase Details
Closed on
Nov 24, 2004
Sold by
Cdms Inc
Bought by
Henry Wendel
Home Financials for this Owner
Home Financials are based on the most recent Mortgage that was taken out on this home.
Original Mortgage
$126,000
Interest Rate
5.6%
Mortgage Type
New Conventional
Purchase Details
Closed on
Sep 20, 2004
Sold by
Us Bank Na
Bought by
Cdms Inc
Home Financials for this Owner
Home Financials are based on the most recent Mortgage that was taken out on this home.
Original Mortgage
$54,000
Interest Rate
5.73%
Purchase Details
Closed on
May 4, 2004
Sold by
Johnson Malcolm
Bought by
Us Bk
Purchase Details
Closed on
Feb 11, 2002
Sold by
Foxworthy Inc
Bought by
Johnson Malcolm L
Create a Home Valuation Report for This Property
The Home Valuation Report is an in-depth analysis detailing your home's value as well as a comparison with similar homes in the area
Home Values in the Area
Average Home Value in this Area
Purchase History
| Date | Buyer | Sale Price | Title Company |
|---|---|---|---|
| Morehouse College | $27,900 | -- | |
| Pavilack Industries Inc | $73,000 | -- | |
| Atlanta Investing Inc | $45,000 | -- | |
| Aurora Loan Services Llc | $130,000 | -- | |
| Tenpow Ivan G | $225,000 | -- | |
| Tenpow Ivan G | $225,000 | -- | |
| Tenpow Ivan G | $225,000 | -- | |
| Henry Wendel | $85,000 | -- | |
| Cdms Inc | $49,900 | -- | |
| Us Bk | $57,045 | -- | |
| Johnson Malcolm L | -- | -- |
Source: Public Records
Mortgage History
| Date | Status | Borrower | Loan Amount |
|---|---|---|---|
| Previous Owner | Pavilack Industries Inc | $110,000 | |
| Previous Owner | Atlanta Investing Inc | $38,250 | |
| Previous Owner | Tenpow Ivan G | $202,500 | |
| Previous Owner | Tenpow Ivan G | $202,500 | |
| Previous Owner | Tenpow Ivan G | $202,500 | |
| Previous Owner | Henry Wendel | $126,000 | |
| Previous Owner | Cdms Inc | $54,000 |
Source: Public Records
Tax History Compared to Growth
Tax History
| Year | Tax Paid | Tax Assessment Tax Assessment Total Assessment is a certain percentage of the fair market value that is determined by local assessors to be the total taxable value of land and additions on the property. | Land | Improvement |
|---|---|---|---|---|
| 2025 | $1,031 | $32,320 | $32,320 | -- |
| 2023 | $1,371 | $33,120 | $33,120 | $0 |
| 2022 | $750 | $18,520 | $18,520 | $0 |
| 2021 | $893 | $22,040 | $22,040 | $0 |
| 2020 | $893 | $21,800 | $21,800 | $0 |
| 2019 | $418 | $10,360 | $10,360 | $0 |
| 2018 | $419 | $10,120 | $10,120 | $0 |
| 2017 | $93 | $2,160 | $2,160 | $0 |
| 2016 | $94 | $2,160 | $2,160 | $0 |
| 2015 | $552 | $2,160 | $2,160 | $0 |
| 2014 | $98 | $2,160 | $2,160 | $0 |
Source: Public Records
Map
Nearby Homes
- 827 Drummond St SW
- 836 Mitchell St SW
- 821 Beckwith St SW
- 111 Ozone St SW
- 119 Ozone St SW
- 67 Joseph E Lowery Blvd SW
- 150 Joseph E Lowery Blvd SW
- 60 Newcastle St SW
- 943 Washington Place SW
- 870 Mayson Turner Rd NW Unit 1230
- 870 Mayson Turner Rd NW Unit 1207
- 870 Mayson Turner Rd NW Unit 1344
- 870 Mayson Turner Rd NW Unit 1209
- 870 Mayson Turner Rd NW Unit 1102
- 870 Mayson Turner Rd NW Unit 1103
- 870 Mayson Turner Rd NW Unit 1238
- 870 Mayson Turner Rd NW Unit 1110
- 870 Mayson Turner Rd NW Unit 1306
- 870 Mayson Turner Rd NW Unit 1228
- 870 Mayson Turner Rd NW Unit 1004
- 834 Drummond St SW
- 844 Drummond St SW
- 830 Drummond St SW
- 846 Drummond St SW
- 841 Beckwith St SW
- 833 Beckwith St SW
- 826 Drummond St SW
- 850 Drummond St SW
- 845 Beckwith St SW
- 839 Drummond St SW
- 835 Drummond St SW
- 829 Beckwith St SW
- 843 Drummond St SW
- 831 Drummond St SW
- 849 Beckwith St SW
- 829 Drummond St SW
- 845 Drummond St SW
- 824 Drummond St SW
- 825 Beckwith St SW
- 853 Beckwith St SW