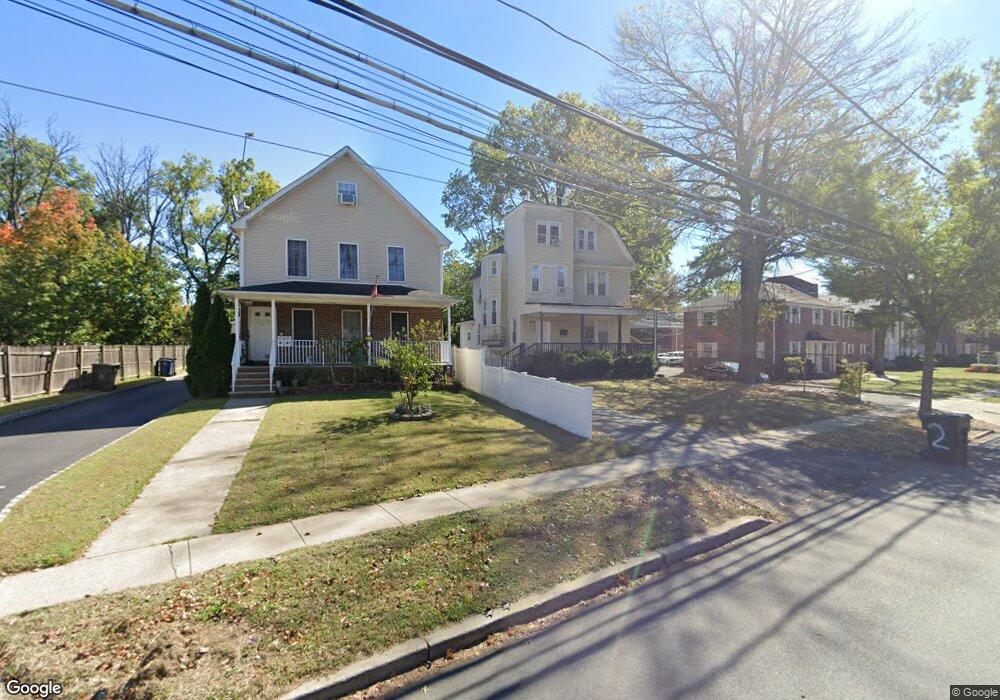
838 E Front St Unit 40 Plainfield, NJ 07062
Estimated Value: $490,775 - $649,000
Studio
--
Bath
3,048
Sq Ft
$186/Sq Ft
Est. Value
About This Home
This home is located at 838 E Front St Unit 40, Plainfield, NJ 07062 and is currently estimated at $567,444, approximately $186 per square foot. 838 E Front St Unit 40 is a home located in Union County with nearby schools including Dewitt D. Barlow Elementary School, Maxson Middle School, and Plainfield High School.
Ownership History
Date
Name
Owned For
Owner Type
Purchase Details
Closed on
Mar 7, 2022
Sold by
Strong Power Properties Llc
Bought by
Torino Investments Llc
Current Estimated Value
Home Financials for this Owner
Home Financials are based on the most recent Mortgage that was taken out on this home.
Original Mortgage
$252,000
Outstanding Balance
$228,546
Interest Rate
1.8%
Mortgage Type
New Conventional
Estimated Equity
$338,898
Purchase Details
Closed on
Nov 16, 2021
Sold by
Gutierrez Victor
Bought by
Strong Power Properties Llc
Purchase Details
Closed on
May 24, 2019
Sold by
Gallo Carmela Ruiz and Gutierrez Victor
Bought by
Gutierrez Victor
Purchase Details
Closed on
Jun 24, 2004
Sold by
Gutlerrez Victor
Bought by
Gutlerrez Victor and Gutlerrez Carmela
Purchase Details
Closed on
Feb 9, 2001
Sold by
Gutierrez Victor and Gutierrez Carmela
Bought by
Gutierrez Victor
Create a Home Valuation Report for This Property
The Home Valuation Report is an in-depth analysis detailing your home's value as well as a comparison with similar homes in the area
Home Values in the Area
Average Home Value in this Area
Purchase History
| Date | Buyer | Sale Price | Title Company |
|---|---|---|---|
| Torino Investments Llc | -- | Investors First Title | |
| Strong Power Properties Llc | $360,000 | Fidelity National Title | |
| Gutierrez Victor | -- | None Available | |
| Gutlerrez Victor | -- | -- | |
| Gutierrez Victor | -- | -- |
Source: Public Records
Mortgage History
| Date | Status | Borrower | Loan Amount |
|---|---|---|---|
| Open | Torino Investments Llc | $252,000 |
Source: Public Records
Tax History
| Year | Tax Paid | Tax Assessment Tax Assessment Total Assessment is a certain percentage of the fair market value that is determined by local assessors to be the total taxable value of land and additions on the property. | Land | Improvement |
|---|---|---|---|---|
| 2025 | $10,767 | $123,300 | $42,500 | $80,800 |
| 2024 | $10,661 | $123,300 | $42,500 | $80,800 |
| 2023 | $10,661 | $123,300 | $42,500 | $80,800 |
| 2022 | $10,430 | $123,300 | $42,500 | $80,800 |
| 2021 | $10,339 | $123,300 | $42,500 | $80,800 |
| 2020 | $10,309 | $123,300 | $42,500 | $80,800 |
| 2019 | $10,309 | $123,300 | $42,500 | $80,800 |
| 2018 | $10,093 | $123,300 | $42,500 | $80,800 |
| 2017 | $9,847 | $123,300 | $42,500 | $80,800 |
| 2016 | $9,646 | $123,300 | $42,500 | $80,800 |
| 2015 | $9,361 | $123,300 | $42,500 | $80,800 |
| 2014 | -- | $123,300 | $42,500 | $80,800 |
Source: Public Records
Map
Nearby Homes
- 835 E 2nd St
- 820 E 2nd St
- 358-400 E 2nd St
- 836 E 2nd St Unit 38
- 935 E Front St Unit C
- 949 E Front St
- 949 E Front St Unit A
- 814-20 E 3rd St
- 808 E 3rd St
- 925 E Front St Unit 66
- 708 E Front St Unit 5
- 162 Mali Dr
- 125 Leland Ave Unit 27
- 329 Berckman St
- 549 E 2nd St Unit 51
- 234 Brook Ave
- 228 Oneida Place
- 536 E 2nd St Unit 38
- 155 Netherwood Ave
- 225 Sumner Ave Unit 27
- 842 E Front St Unit 44
- 846 E Front St Unit 48
- 850 E Front St Unit 52
- 854 E Front St Unit 56
- 858 E Front St Unit 60
- 130 Mckinley Place
- 131 Mckinley Place
- 802 E Front St Unit 14
- 802 E Front St Unit B-17
- 802 E Front St
- 862 E Front St
- 116 Johnston Ave Unit 18
- 120 Johnston Ave Unit 22
- 124 Johnston Ave
- 112 Johnston Ave Unit 14
- 864 E Front St Unit 66
- 126 Johnston Ave Unit 28
- 133 Mckinley Place Unit 35
- 133-35 Mckinley Place
- 130 Johnston Ave
Your Personal Tour Guide
Ask me questions while you tour the home.