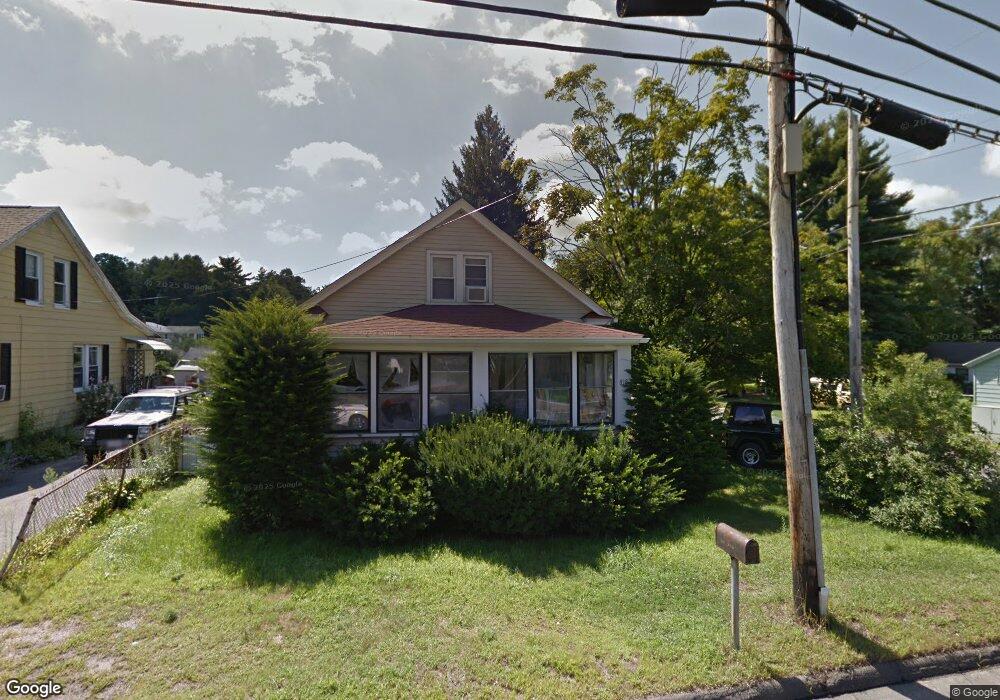
838 East St Ludlow, MA 01056
Estimated Value: $217,000 - $322,000
2
Beds
2
Baths
986
Sq Ft
$266/Sq Ft
Est. Value
About This Home
This home is located at 838 East St, Ludlow, MA 01056 and is currently estimated at $262,607, approximately $266 per square foot. 838 East St is a home located in Hampden County with nearby schools including East Street Elementary School, Chapin Street Elementary School, and Paul R. Baird Middle School.
Ownership History
Date
Name
Owned For
Owner Type
Purchase Details
Closed on
Jan 28, 1993
Sold by
Asselin Richard R and Asselin Carole A
Bought by
Havens John R and Havens Bonnie M
Current Estimated Value
Home Financials for this Owner
Home Financials are based on the most recent Mortgage that was taken out on this home.
Original Mortgage
$75,450
Interest Rate
8.16%
Mortgage Type
Purchase Money Mortgage
Create a Home Valuation Report for This Property
The Home Valuation Report is an in-depth analysis detailing your home's value as well as a comparison with similar homes in the area
Home Values in the Area
Average Home Value in this Area
Purchase History
| Date | Buyer | Sale Price | Title Company |
|---|---|---|---|
| Havens John R | $75,000 | -- | |
| Havens John R | $75,000 | -- |
Source: Public Records
Mortgage History
| Date | Status | Borrower | Loan Amount |
|---|---|---|---|
| Open | Havens John R | $86,000 | |
| Closed | Havens John R | $75,450 |
Source: Public Records
Tax History Compared to Growth
Tax History
| Year | Tax Paid | Tax Assessment Tax Assessment Total Assessment is a certain percentage of the fair market value that is determined by local assessors to be the total taxable value of land and additions on the property. | Land | Improvement |
|---|---|---|---|---|
| 2025 | $3,532 | $203,600 | $69,800 | $133,800 |
| 2024 | $3,452 | $190,800 | $69,800 | $121,000 |
| 2023 | $3,205 | $164,300 | $61,300 | $103,000 |
| 2022 | $3,066 | $153,400 | $61,300 | $92,100 |
| 2021 | $3,088 | $146,500 | $61,300 | $85,200 |
| 2020 | $2,961 | $143,600 | $60,400 | $83,200 |
| 2019 | $2,745 | $138,500 | $59,800 | $78,700 |
| 2018 | $2,578 | $135,600 | $59,800 | $75,800 |
| 2017 | $2,442 | $131,800 | $58,600 | $73,200 |
| 2016 | $2,321 | $128,000 | $57,400 | $70,600 |
| 2015 | $2,089 | $120,800 | $56,800 | $64,000 |
Source: Public Records
Map
Nearby Homes
- 138 Ridgeview Cir
- 51 Newcrest St
- 142 Amherst St
- 148 Yale St
- 51 Parkview St
- 425 Miller St
- 308 Miller St Unit 72
- 308 Miller St Unit 79
- 308 Miller St Unit 78
- 415 Winsor St
- 229 Miller St Unit F-13
- 229 Miller St Unit C-1
- 229 Miller St Unit B2
- 70 Sroka Ln
- 87 Haviland St
- 41 Orchard St
- 37 Franklin St
- 287 East St
- 84 Chapin Greene Dr
- Lot 28 Tower Rd