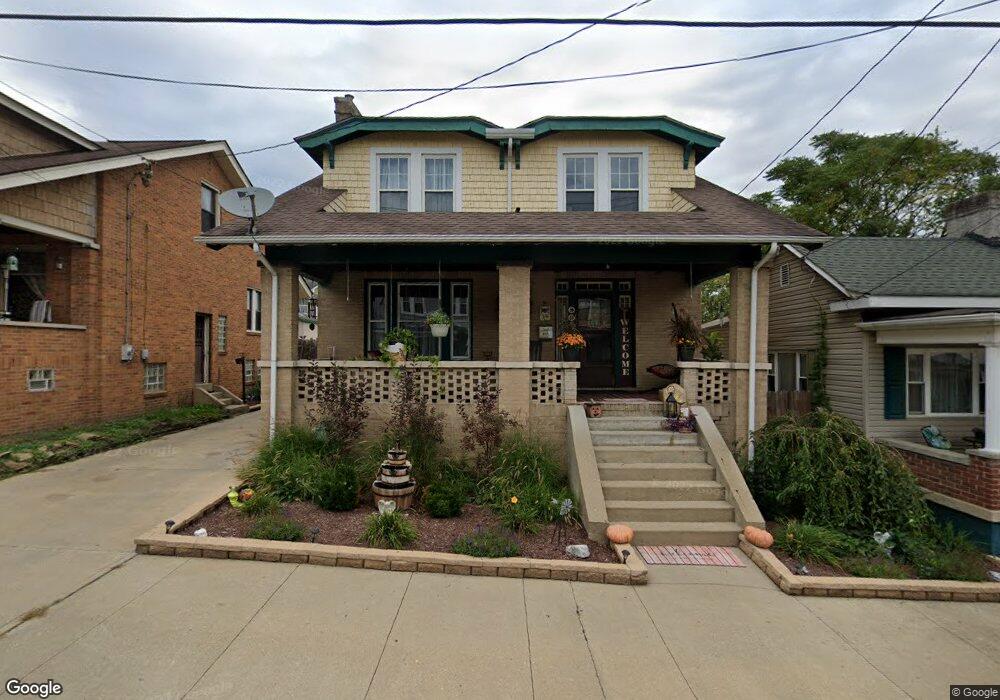
838 Hanover St Martins Ferry, OH 43935
Estimated Value: $129,321 - $167,000
4
Beds
1
Bath
1,629
Sq Ft
$90/Sq Ft
Est. Value
About This Home
This home is located at 838 Hanover St, Martins Ferry, OH 43935 and is currently estimated at $146,080, approximately $89 per square foot. 838 Hanover St is a home located in Belmont County with nearby schools including Anna Marie Ayers Elementary School, Martins Ferry Middle School, and Martins Ferry High School.
Ownership History
Date
Name
Owned For
Owner Type
Purchase Details
Closed on
Sep 30, 2014
Sold by
Robey Joyce M
Bought by
Robey Kenneth C
Current Estimated Value
Purchase Details
Closed on
Mar 30, 1993
Sold by
Robey Kenneth C and Robey Joyc
Bought by
Robey Kenneth C and Robey Joyc
Purchase Details
Closed on
Jan 1, 1986
Sold by
Wensyel Scott R
Bought by
Wensyel Scott R
Create a Home Valuation Report for This Property
The Home Valuation Report is an in-depth analysis detailing your home's value as well as a comparison with similar homes in the area
Home Values in the Area
Average Home Value in this Area
Purchase History
| Date | Buyer | Sale Price | Title Company |
|---|---|---|---|
| Robey Kenneth C | -- | Attorney | |
| Robey Kenneth C | $59,000 | -- | |
| Wensyel Scott R | -- | -- |
Source: Public Records
Tax History Compared to Growth
Tax History
| Year | Tax Paid | Tax Assessment Tax Assessment Total Assessment is a certain percentage of the fair market value that is determined by local assessors to be the total taxable value of land and additions on the property. | Land | Improvement |
|---|---|---|---|---|
| 2024 | $1,863 | $45,400 | $2,660 | $42,740 |
| 2023 | $1,560 | $34,860 | $2,550 | $32,310 |
| 2022 | $1,560 | $34,856 | $2,548 | $32,308 |
| 2021 | $1,552 | $34,863 | $2,548 | $32,315 |
| 2020 | $1,455 | $30,320 | $2,220 | $28,100 |
| 2019 | $1,457 | $30,320 | $2,220 | $28,100 |
| 2018 | $1,387 | $30,320 | $2,220 | $28,100 |
| 2017 | $1,416 | $29,900 | $1,970 | $27,930 |
| 2016 | $1,420 | $29,900 | $1,970 | $27,930 |
| 2015 | $1,280 | $29,900 | $1,970 | $27,930 |
| 2014 | $1,108 | $25,660 | $1,790 | $23,870 |
| 2013 | $1,054 | $25,660 | $1,790 | $23,870 |
Source: Public Records
Map
Nearby Homes