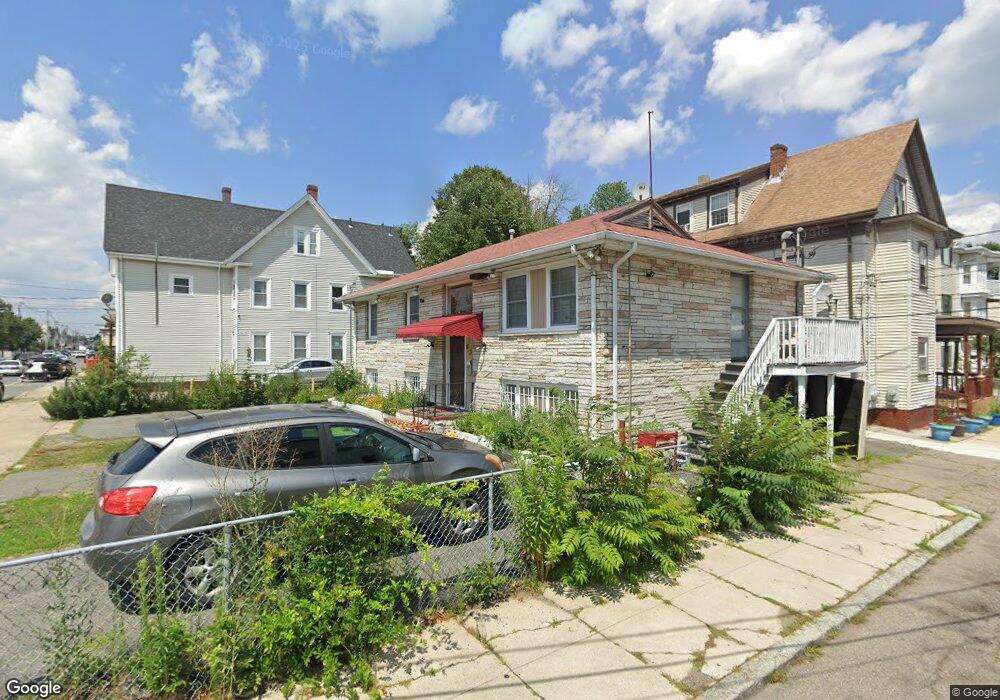
838 Main St Brockton, MA 02301
Clifton Heights NeighborhoodEstimated Value: $459,000 - $548,000
3
Beds
3
Baths
1,637
Sq Ft
$310/Sq Ft
Est. Value
About This Home
This home is located at 838 Main St, Brockton, MA 02301 and is currently estimated at $506,762, approximately $309 per square foot. 838 Main St is a home located in Plymouth County with nearby schools including Davis K-8 School, John F. Kennedy Elementary School, and South Middle School.
Ownership History
Date
Name
Owned For
Owner Type
Purchase Details
Closed on
Dec 17, 2008
Sold by
Dafonseca David A and Fonseca David A
Bought by
Silva Lucelina R
Current Estimated Value
Purchase Details
Closed on
Dec 29, 2003
Sold by
One Way Rt
Bought by
Dasilva Joao J and Silva Lucelina R
Home Financials for this Owner
Home Financials are based on the most recent Mortgage that was taken out on this home.
Original Mortgage
$157,500
Interest Rate
6.01%
Mortgage Type
Purchase Money Mortgage
Purchase Details
Closed on
Jan 14, 1998
Sold by
Houde Mary B
Bought by
On The Way Rt
Home Financials for this Owner
Home Financials are based on the most recent Mortgage that was taken out on this home.
Original Mortgage
$24,000
Interest Rate
7.08%
Mortgage Type
Purchase Money Mortgage
Create a Home Valuation Report for This Property
The Home Valuation Report is an in-depth analysis detailing your home's value as well as a comparison with similar homes in the area
Home Values in the Area
Average Home Value in this Area
Purchase History
| Date | Buyer | Sale Price | Title Company |
|---|---|---|---|
| Silva Lucelina R | -- | -- | |
| Pires-Dafonseca David A | -- | -- | |
| Dasilva Joao J | $175,000 | -- | |
| On The Way Rt | $57,000 | -- |
Source: Public Records
Mortgage History
| Date | Status | Borrower | Loan Amount |
|---|---|---|---|
| Previous Owner | On The Way Rt | $157,500 | |
| Previous Owner | On The Way Rt | $24,000 |
Source: Public Records
Tax History Compared to Growth
Tax History
| Year | Tax Paid | Tax Assessment Tax Assessment Total Assessment is a certain percentage of the fair market value that is determined by local assessors to be the total taxable value of land and additions on the property. | Land | Improvement |
|---|---|---|---|---|
| 2025 | $5,595 | $462,000 | $129,300 | $332,700 |
| 2024 | $5,428 | $451,600 | $129,300 | $322,300 |
| 2023 | $5,310 | $409,100 | $98,300 | $310,800 |
| 2022 | $4,815 | $344,700 | $88,800 | $255,900 |
| 2021 | $4,465 | $307,900 | $72,900 | $235,000 |
| 2020 | $4,297 | $283,600 | $69,500 | $214,100 |
| 2019 | $4,051 | $260,700 | $65,900 | $194,800 |
| 2018 | $3,768 | $234,600 | $65,900 | $168,700 |
| 2017 | $3,613 | $224,400 | $65,900 | $158,500 |
| 2016 | $3,111 | $179,200 | $63,800 | $115,400 |
| 2015 | $2,987 | $164,600 | $63,800 | $100,800 |
| 2014 | $2,603 | $143,600 | $63,800 | $79,800 |
Source: Public Records
Map
Nearby Homes