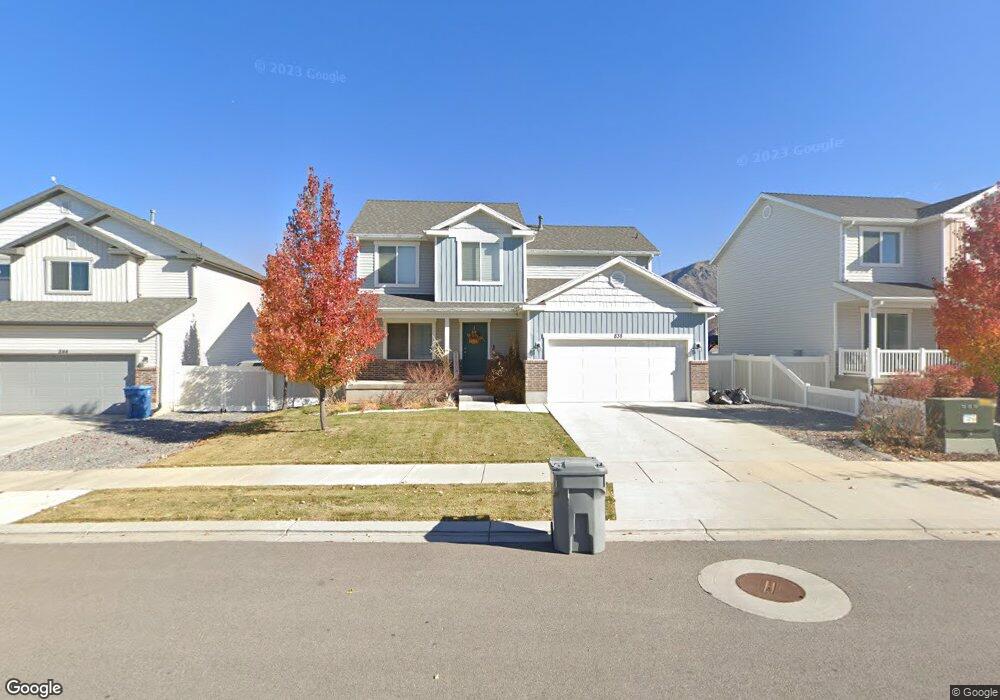
838 N 50 W Santaquin, UT 84655
Estimated Value: $474,000 - $554,000
4
Beds
3
Baths
1,829
Sq Ft
$282/Sq Ft
Est. Value
About This Home
This home is located at 838 N 50 W, Santaquin, UT 84655 and is currently estimated at $515,159, approximately $281 per square foot. 838 N 50 W is a home with nearby schools including Apple Valley Elementary, Payson Junior High School, and Payson High School.
Ownership History
Date
Name
Owned For
Owner Type
Purchase Details
Closed on
Jul 30, 2020
Sold by
Steele Daniel K
Bought by
Steele Daniel Kent
Current Estimated Value
Home Financials for this Owner
Home Financials are based on the most recent Mortgage that was taken out on this home.
Original Mortgage
$214,300
Outstanding Balance
$190,450
Interest Rate
3.1%
Mortgage Type
New Conventional
Estimated Equity
$324,709
Purchase Details
Closed on
Feb 20, 2018
Sold by
Sierra Homes Construction South Llc
Bought by
Steele Daniel K
Home Financials for this Owner
Home Financials are based on the most recent Mortgage that was taken out on this home.
Original Mortgage
$214,670
Interest Rate
4.15%
Mortgage Type
New Conventional
Purchase Details
Closed on
Sep 11, 2017
Sold by
Siera Homes Constuction South Llc
Bought by
Bank Of Utah
Create a Home Valuation Report for This Property
The Home Valuation Report is an in-depth analysis detailing your home's value as well as a comparison with similar homes in the area
Home Values in the Area
Average Home Value in this Area
Purchase History
| Date | Buyer | Sale Price | Title Company |
|---|---|---|---|
| Steele Daniel Kent | -- | Inwest Title Orem | |
| Steele Daniel K | -- | American Secure Title Tremon | |
| Bank Of Utah | -- | American Secure Title | |
| Sierra Homes Construction South Llc | -- | None Available |
Source: Public Records
Mortgage History
| Date | Status | Borrower | Loan Amount |
|---|---|---|---|
| Open | Steele Daniel Kent | $214,300 | |
| Closed | Steele Daniel K | $214,670 |
Source: Public Records
Tax History Compared to Growth
Tax History
| Year | Tax Paid | Tax Assessment Tax Assessment Total Assessment is a certain percentage of the fair market value that is determined by local assessors to be the total taxable value of land and additions on the property. | Land | Improvement |
|---|---|---|---|---|
| 2025 | $2,209 | $246,345 | $135,800 | $312,100 |
| 2024 | $2,209 | $219,945 | $0 | $0 |
| 2023 | $2,318 | $231,550 | $0 | $0 |
| 2022 | $2,257 | $232,595 | $0 | $0 |
| 2021 | $1,941 | $310,000 | $76,600 | $233,400 |
| 2020 | $1,867 | $288,900 | $66,600 | $222,300 |
| 2019 | $1,642 | $259,900 | $66,600 | $193,300 |
| 2018 | $1,486 | $123,365 | $0 | $0 |
Source: Public Records
Map
Nearby Homes
- 116 E 840 N
- 41 W 770 N
- 894 N Apple Seed Ln
- 109 W 930 N
- 961 N 120 E
- 1032 N Apple Seed Ln
- Pine Plan at Stratton Acres
- Willow Plan at Stratton Acres
- Aspen Plan at Stratton Acres
- Cottonwood Plan at Stratton Acres
- 951 N 215 W
- 949 N 215 W
- 947 N 215 W
- 953 N 215 W
- 943 N 200 E Unit 31
- McIntosh Plan at The Orchards
- Honey Plan at The Orchards
- Cranford Plan at The Orchards
- Monroe Plan at The Orchards
- Benson Plan at The Orchards