Estimated Value: $66,000 - $118,000
3
Beds
1
Bath
1,764
Sq Ft
$48/Sq Ft
Est. Value
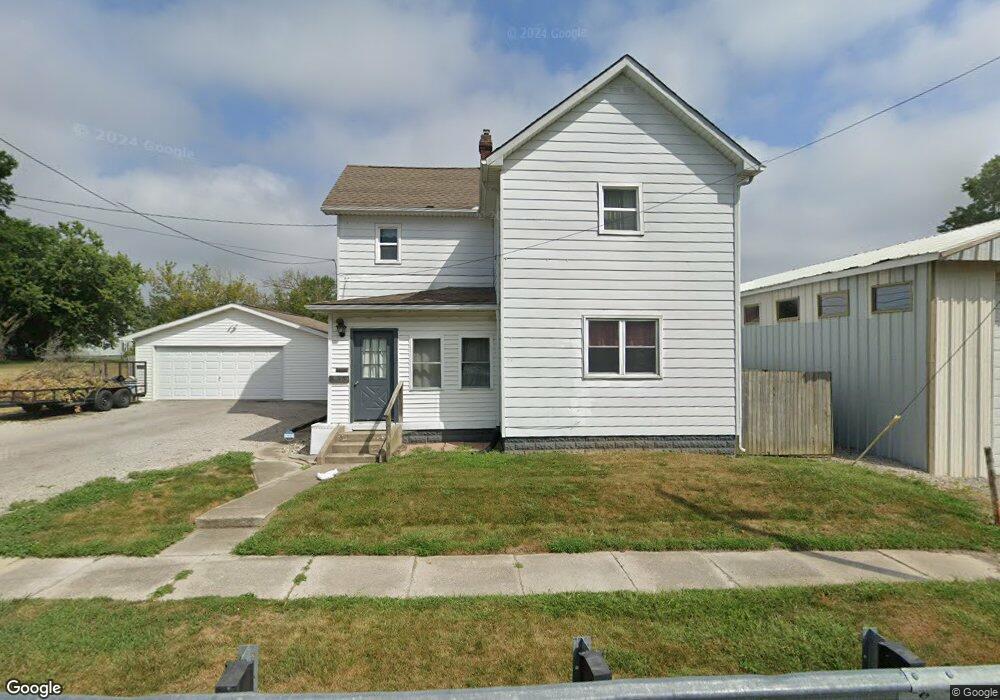
About This Home
This home is located at 838 N Union St, Lima, OH 45801 and is currently estimated at $84,439, approximately $47 per square foot. 838 N Union St is a home located in Allen County with nearby schools including Independence Elementary School, Lima North Middle School, and Lima West Middle School.
Ownership History
Date
Name
Owned For
Owner Type
Purchase Details
Closed on
May 12, 2010
Sold by
Daley Timothy L and Daley Becki
Bought by
Daley Jennifer N and Daley Timothy L
Current Estimated Value
Home Financials for this Owner
Home Financials are based on the most recent Mortgage that was taken out on this home.
Original Mortgage
$19,000
Outstanding Balance
$6,312
Interest Rate
5.16%
Mortgage Type
New Conventional
Estimated Equity
$78,127
Purchase Details
Closed on
Aug 14, 2006
Sold by
Costello William D and Costello Carol
Bought by
Barginere Derrick Lorenz and Barginere Ornisa Lena
Home Financials for this Owner
Home Financials are based on the most recent Mortgage that was taken out on this home.
Original Mortgage
$13,780
Interest Rate
6.88%
Mortgage Type
Stand Alone Second
Purchase Details
Closed on
May 17, 1996
Sold by
Hefner Inez
Bought by
Hefner Warren and Hefner Patricia
Purchase Details
Closed on
May 17, 1991
Bought by
Hefner Inez L
Create a Home Valuation Report for This Property
The Home Valuation Report is an in-depth analysis detailing your home's value as well as a comparison with similar homes in the area
Purchase History
| Date | Buyer | Sale Price | Title Company |
|---|---|---|---|
| Daley Jennifer N | $32,000 | Attorney | |
| Barginere Derrick Lorenz | $68,900 | None Available | |
| Hefner Warren | $3,000 | -- | |
| Hefner Inez L | $20,000 | -- |
Source: Public Records
Mortgage History
| Date | Status | Borrower | Loan Amount |
|---|---|---|---|
| Open | Daley Jennifer N | $19,000 | |
| Closed | Barginere Derrick Lorenz | $13,780 | |
| Open | Barginere Derrick Lorenz | $55,120 | |
| Closed | Hefner Warren | $0 |
Source: Public Records
Tax History
| Year | Tax Paid | Tax Assessment Tax Assessment Total Assessment is a certain percentage of the fair market value that is determined by local assessors to be the total taxable value of land and additions on the property. | Land | Improvement |
|---|---|---|---|---|
| 2024 | $571 | $14,770 | $2,310 | $12,460 |
| 2023 | $616 | $14,080 | $2,210 | $11,870 |
| 2022 | $618 | $14,080 | $2,210 | $11,870 |
| 2021 | $654 | $14,080 | $2,210 | $11,870 |
| 2020 | $603 | $11,420 | $2,140 | $9,280 |
| 2019 | $603 | $11,420 | $2,140 | $9,280 |
| 2018 | $597 | $11,420 | $2,140 | $9,280 |
| 2017 | $605 | $11,420 | $2,140 | $9,280 |
| 2016 | $614 | $11,420 | $2,140 | $9,280 |
| 2015 | $601 | $11,420 | $2,140 | $9,280 |
| 2014 | $601 | $10,990 | $2,310 | $8,680 |
| 2013 | $585 | $10,990 | $2,310 | $8,680 |
Source: Public Records
Map
Nearby Homes
- 919 N Main St
- 735 N Elizabeth St
- 922 N Jefferson St
- 316 Ewing Ave
- 406 Ewing Ave
- 514 & 516 N Elizabeth St
- 1021 N McDonel St
- 416 Hazel Ave
- 435 Marian Ave
- 934 N Metcalf St
- 557 W Ashton Ave
- 576 W Ashton Ave
- 1435 N Central Ave
- 608 W O'Connor Ave
- 5 Unit Package
- 645 W O'Connor Ave
- 816 N Baxter St
- 325 N McDonel St
- 841 N Baxter St
- 555 Haller St
Your Personal Tour Guide
Ask me questions while you tour the home.