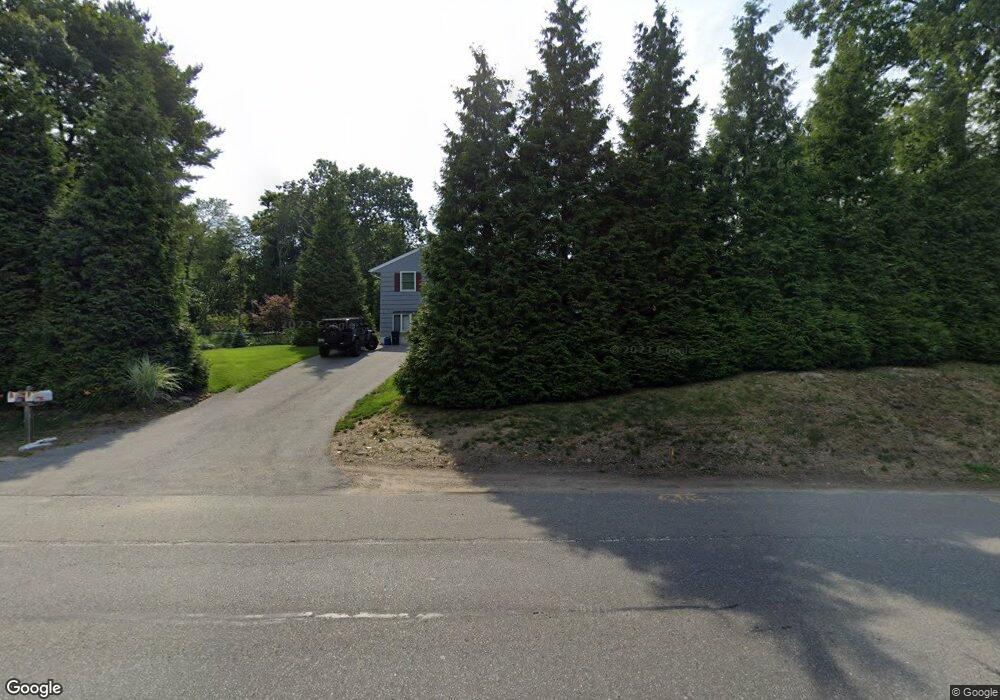
838 Osgood St North Andover, MA 01845
Estimated Value: $799,344 - $966,000
4
Beds
4
Baths
1,787
Sq Ft
$481/Sq Ft
Est. Value
About This Home
This home is located at 838 Osgood St, North Andover, MA 01845 and is currently estimated at $860,336, approximately $481 per square foot. 838 Osgood St is a home located in Essex County with nearby schools including Thomson Elementary School, North Andover Middle School, and North Andover High School.
Ownership History
Date
Name
Owned For
Owner Type
Purchase Details
Closed on
Oct 24, 2014
Sold by
Faraci Annina
Bought by
Nina Faraci T
Current Estimated Value
Purchase Details
Closed on
May 16, 1994
Sold by
Sollie Rt
Bought by
Faraci Annina
Home Financials for this Owner
Home Financials are based on the most recent Mortgage that was taken out on this home.
Original Mortgage
$135,000
Interest Rate
7.93%
Mortgage Type
Purchase Money Mortgage
Purchase Details
Closed on
Mar 19, 1987
Sold by
Sullivan Daniel J
Bought by
Sollie Santina I
Home Financials for this Owner
Home Financials are based on the most recent Mortgage that was taken out on this home.
Original Mortgage
$100,000
Interest Rate
9.02%
Mortgage Type
Purchase Money Mortgage
Create a Home Valuation Report for This Property
The Home Valuation Report is an in-depth analysis detailing your home's value as well as a comparison with similar homes in the area
Home Values in the Area
Average Home Value in this Area
Purchase History
| Date | Buyer | Sale Price | Title Company |
|---|---|---|---|
| Nina Faraci T | -- | -- | |
| Faraci Annina | $195,000 | -- | |
| Sollie Santina I | $196,000 | -- |
Source: Public Records
Mortgage History
| Date | Status | Borrower | Loan Amount |
|---|---|---|---|
| Previous Owner | Sollie Santina I | $98,000 | |
| Previous Owner | Sollie Santina I | $135,000 | |
| Previous Owner | Sollie Santina I | $16,000 | |
| Previous Owner | Sollie Santina I | $100,000 |
Source: Public Records
Tax History Compared to Growth
Tax History
| Year | Tax Paid | Tax Assessment Tax Assessment Total Assessment is a certain percentage of the fair market value that is determined by local assessors to be the total taxable value of land and additions on the property. | Land | Improvement |
|---|---|---|---|---|
| 2025 | $7,571 | $672,400 | $322,600 | $349,800 |
| 2024 | $6,991 | $630,400 | $303,600 | $326,800 |
| 2023 | $7,022 | $573,700 | $279,000 | $294,700 |
| 2022 | $6,946 | $513,400 | $250,500 | $262,900 |
| 2021 | $6,827 | $481,800 | $227,700 | $254,100 |
| 2020 | $6,450 | $469,400 | $227,700 | $241,700 |
| 2019 | $5,379 | $401,100 | $159,400 | $241,700 |
| 2018 | $5,828 | $401,100 | $159,400 | $241,700 |
| 2017 | $4,138 | $289,800 | $134,900 | $154,900 |
| 2016 | $4,534 | $317,700 | $132,300 | $185,400 |
| 2015 | $3,878 | $269,500 | $127,800 | $141,700 |
Source: Public Records
Map
Nearby Homes
- 826 Osgood St
- 385 Sutton St
- 29 Brightwood Ave
- 62 Brightwood Ave
- 12 Walker Rd Unit 6
- 0 Great Pond Rd
- 148 Main St Unit A508
- 148 Main St Unit C538
- 148 Main St Unit A307
- 87 French Farm Rd
- 64 2nd St
- 11 W Bradstreet Rd
- 16 Court St
- 35 Bonny Ln
- 98 Mill Pond
- 112 Mill Pond
- 68 Union St
- 115 Mill Pond
- 116 Mill Pond
- 8 Little Rd
- 177 Chadwick St
- 850 Osgood St
- 165 Chadwick St
- 814 Osgood St
- 168 Chadwick St
- 159 Chadwick St
- 93 Surrey Dr
- 870 Osgood St
- 95 Surrey Dr Unit 2
- 153 Chadwick St
- 91 Surrey Dr
- 89 Surrey Dr
- 89 Surrey Dr Unit A
- 800 Osgood St Unit A
- 800 Osgood St Unit 2
- 880 Osgood St
- 30 Foulds Terrace
- 83 Surrey Dr
- 145 Chadwick St
- 20 Foulds Terrace